E2E Design of a unified ecosystem for Animal Disease Monitoring for India

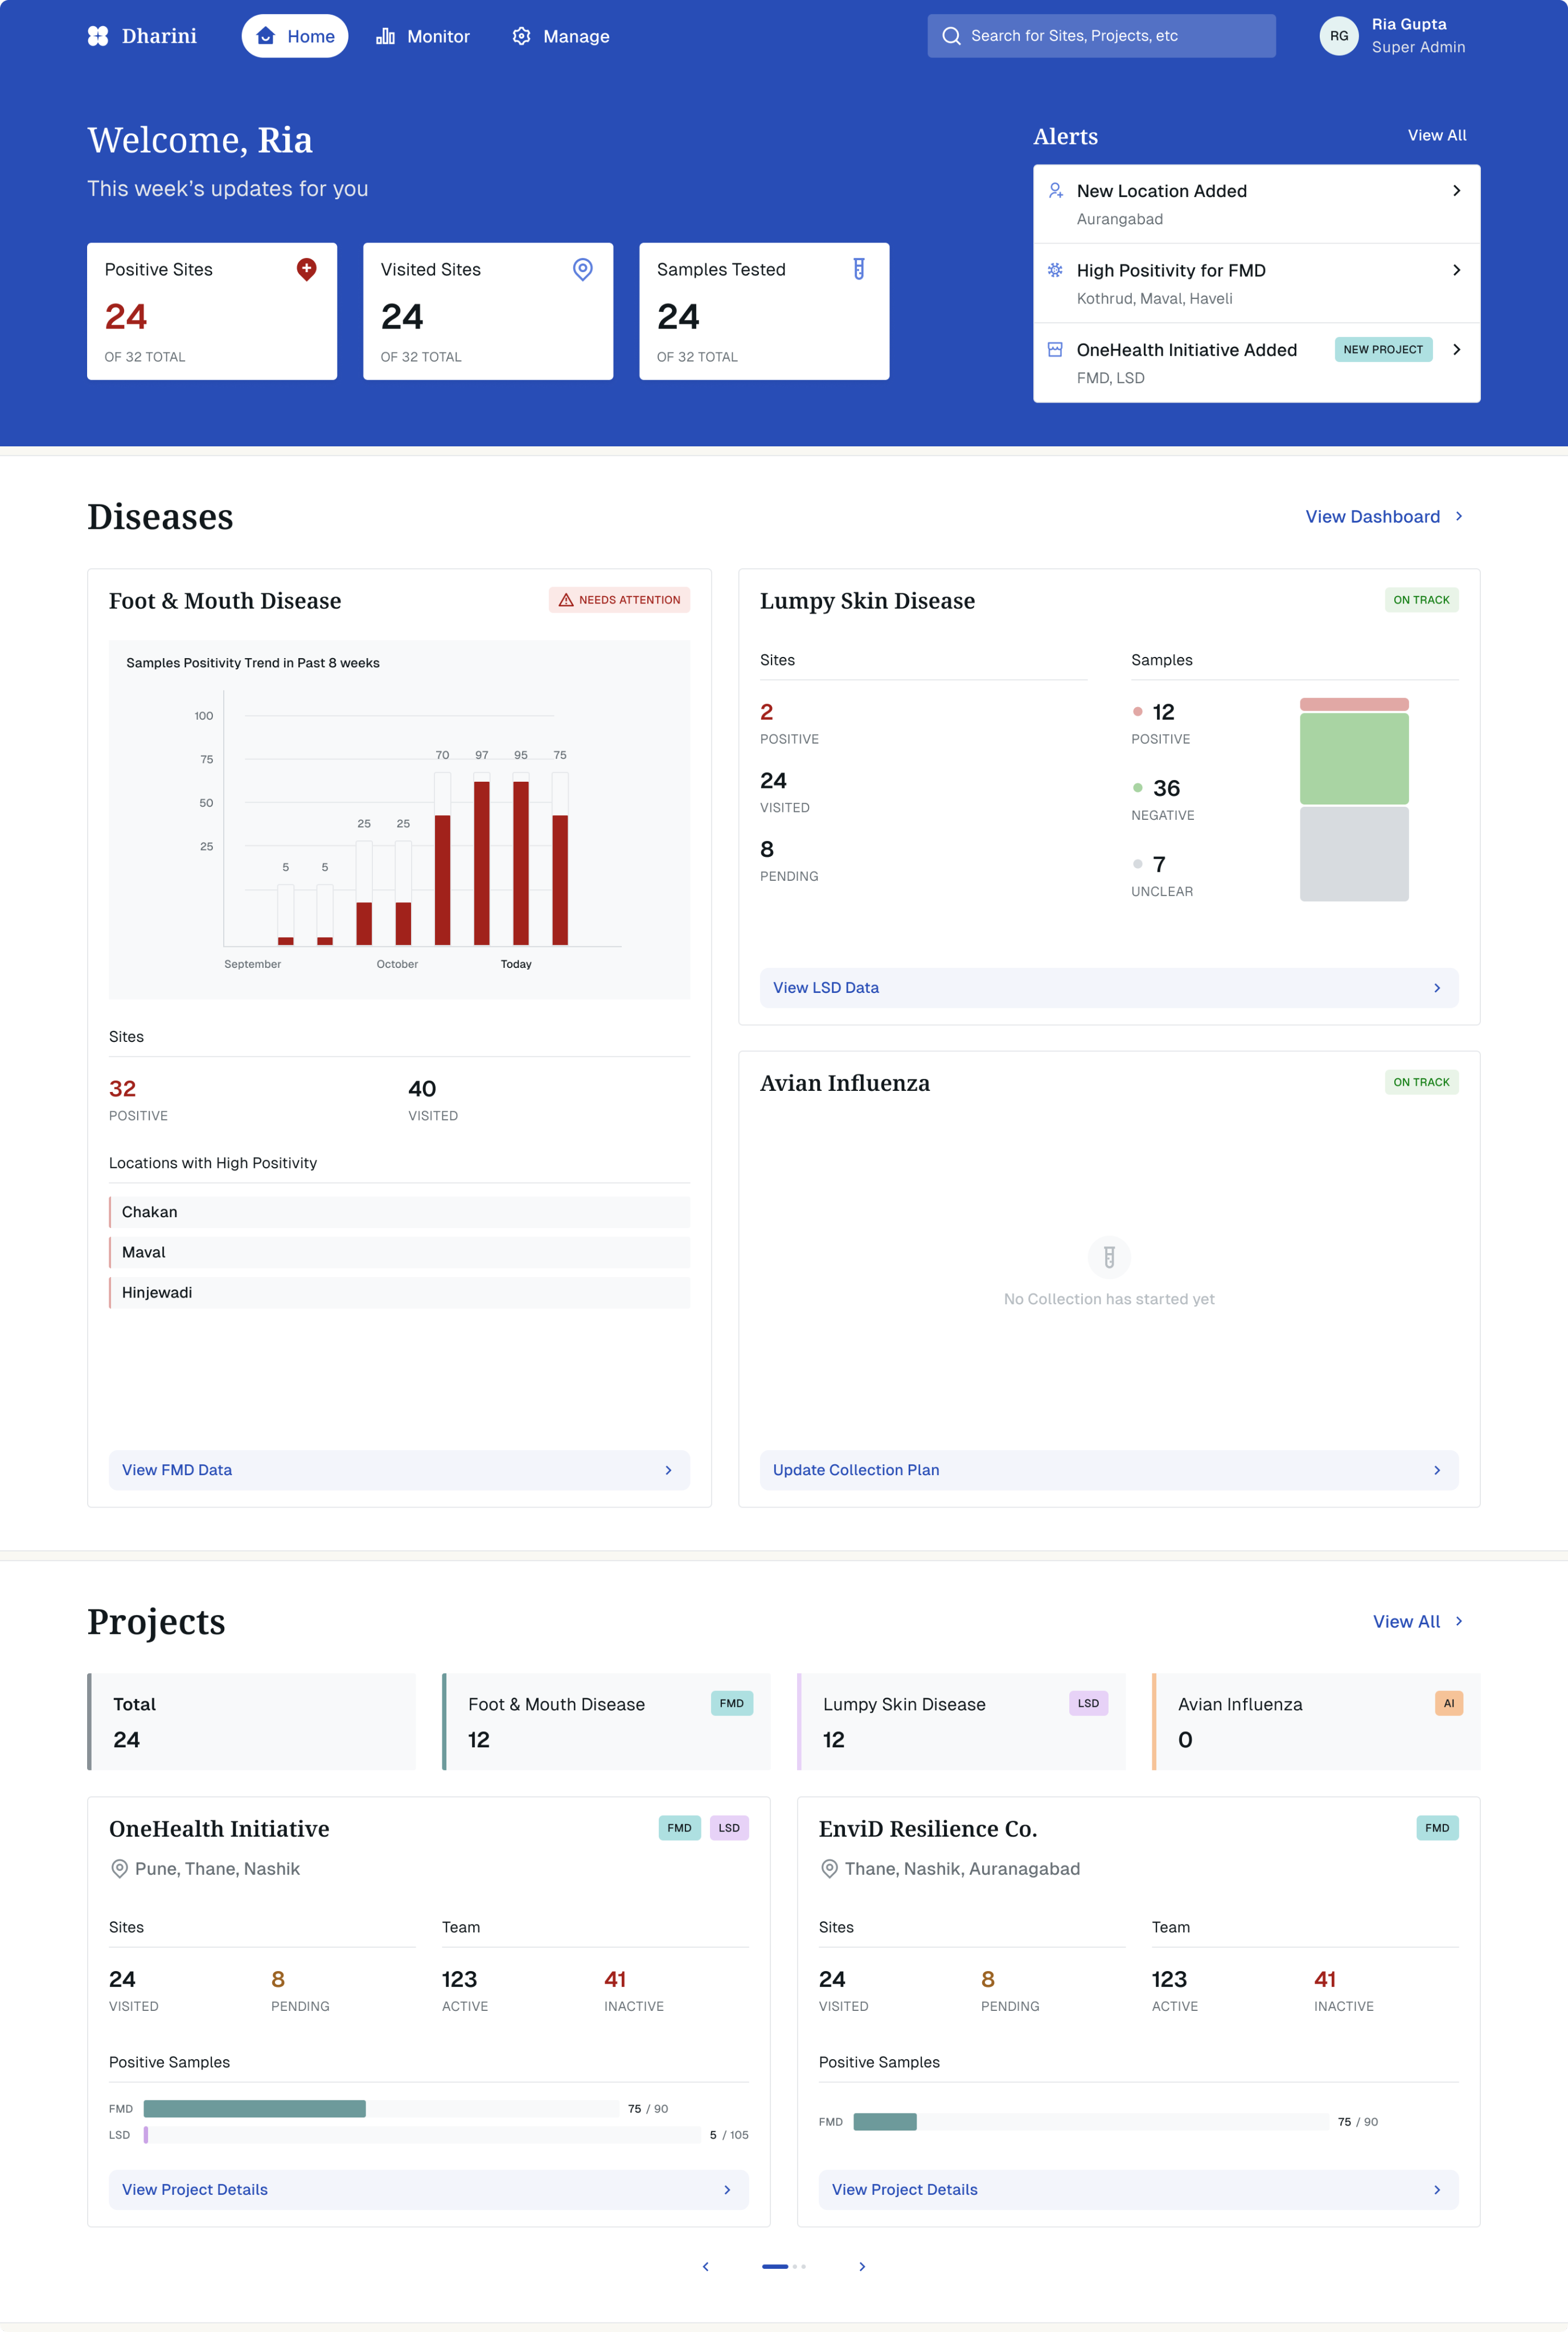
Animal disease monitoring dashboard product shot

MY ROLE

Product Designer

TEAM

Anushka G · Ria G · Me

DURATION

4 Months

CLIENT

ARTPARK × Parallel

CONTEXT

India has lost thousands of livestock due to preventable diseases

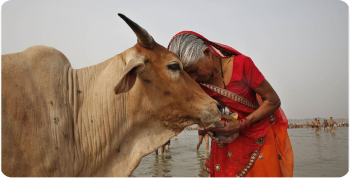
India’s dairy sector is smallholder-dominated — roughly 75% of rural households keep 2–4 animals, and small/marginal farmers hold 60% of female cattle and buffaloes. FMD affecting even one animal can significantly dent household income.

In 2021, India saw 19,363 FMD attacks across 116 districts.

2M+

Cattle Affected

97k+

Deaths across 15 states
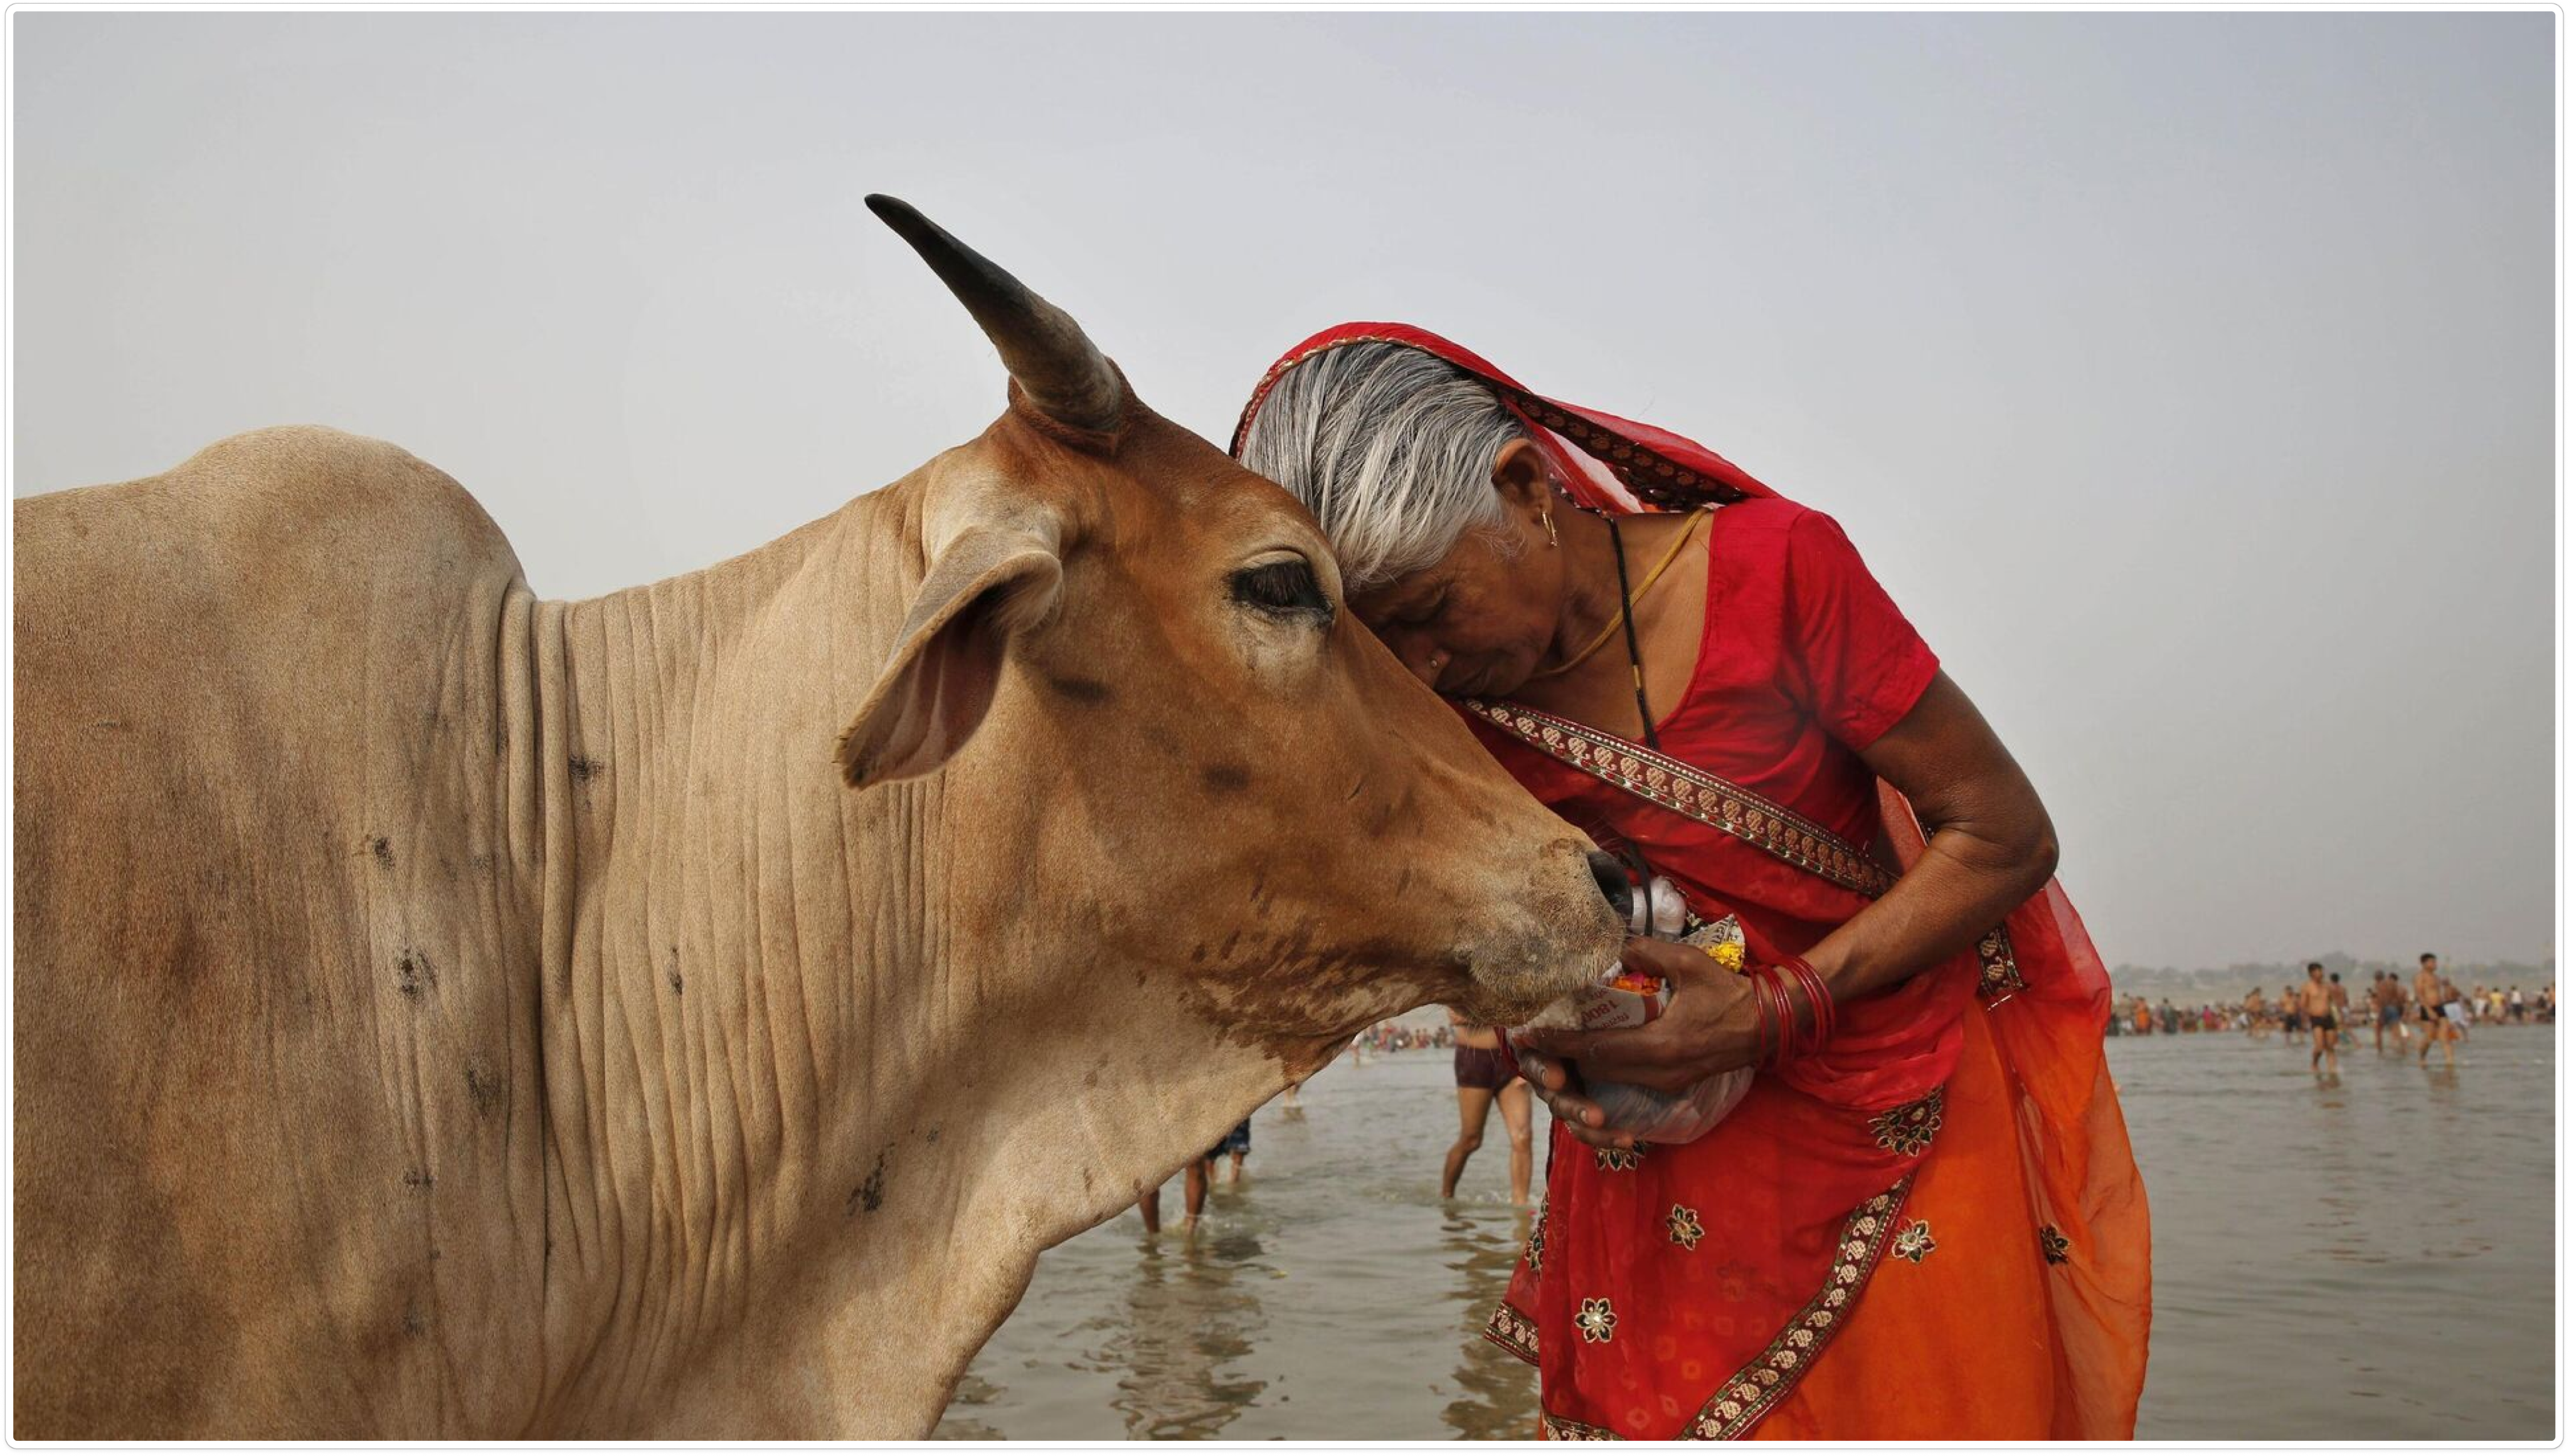
Context supporting image

PROBLEM

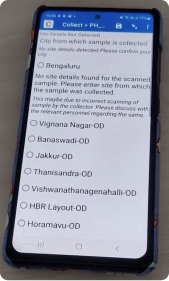
No centralised system to monitor animal diseases

Currently the government has no centralised system to monitor animal diseases like FMD & LSD. The surveillance of these diseases is initiated by multiple stakeholders and is fragmented across geographies and organisations.

This leads to loss of data and delays in initiating vaccine drives.
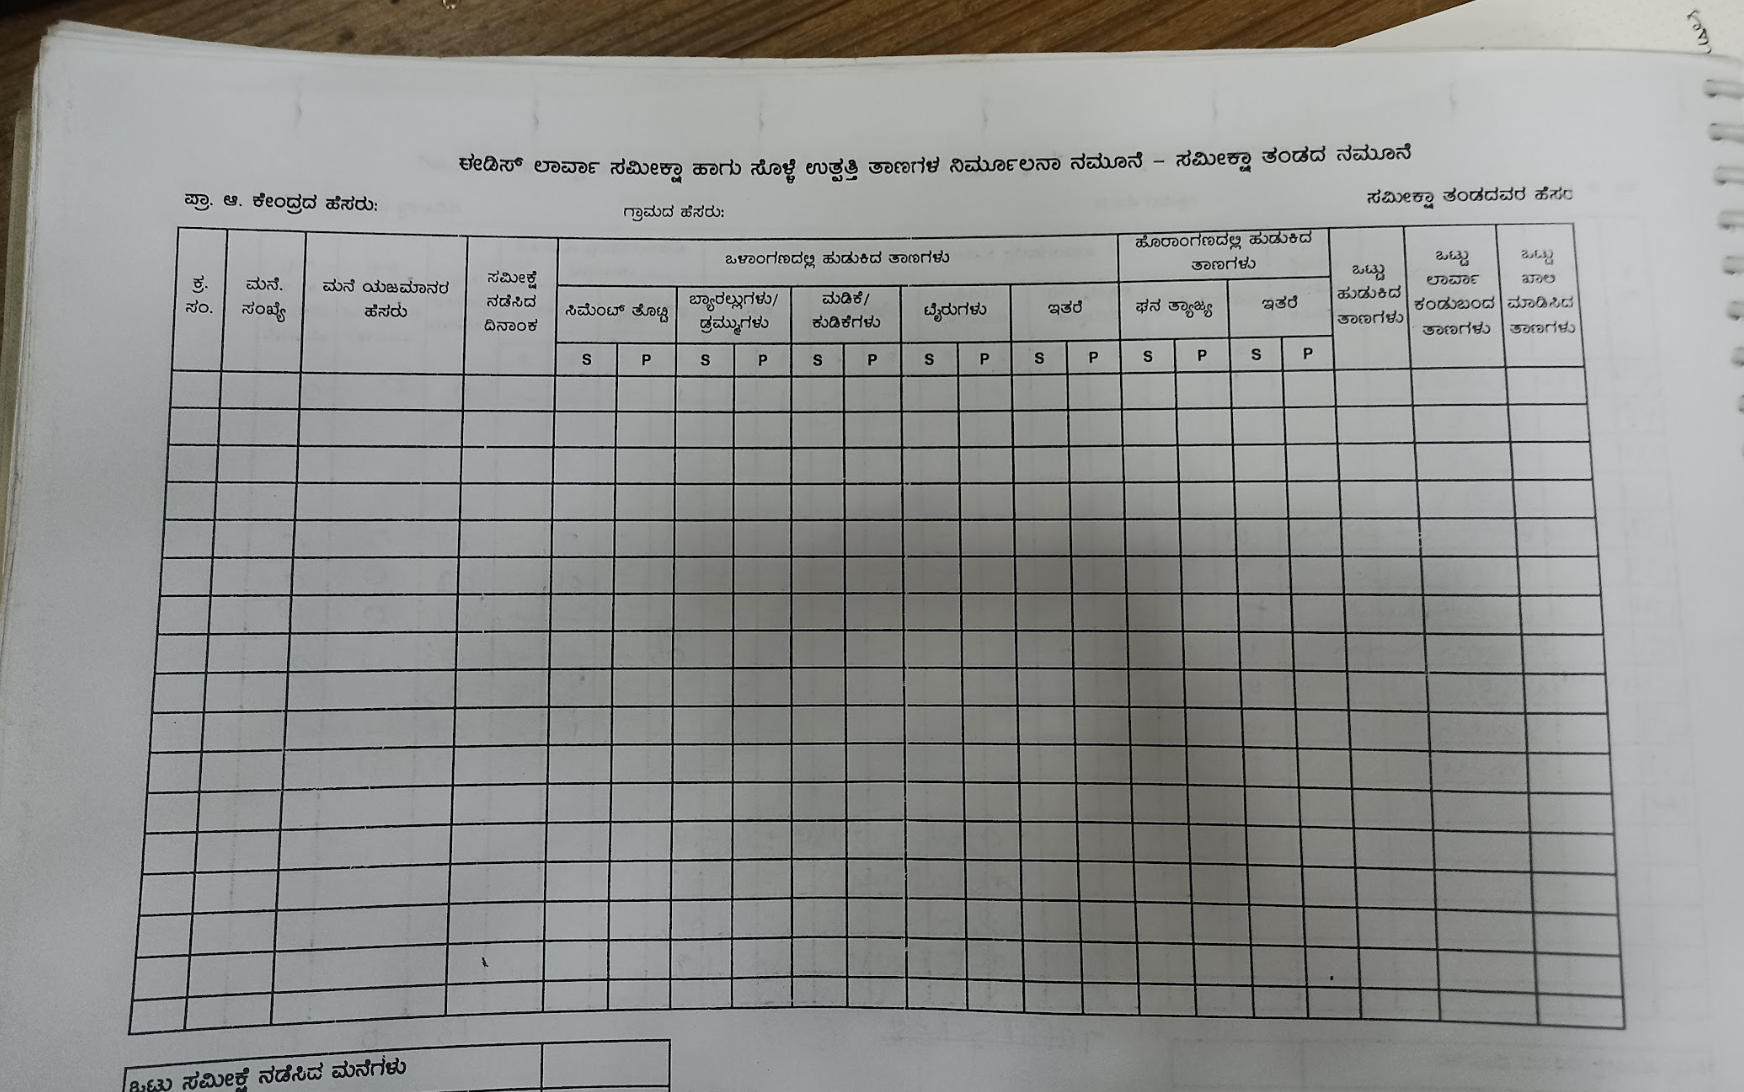
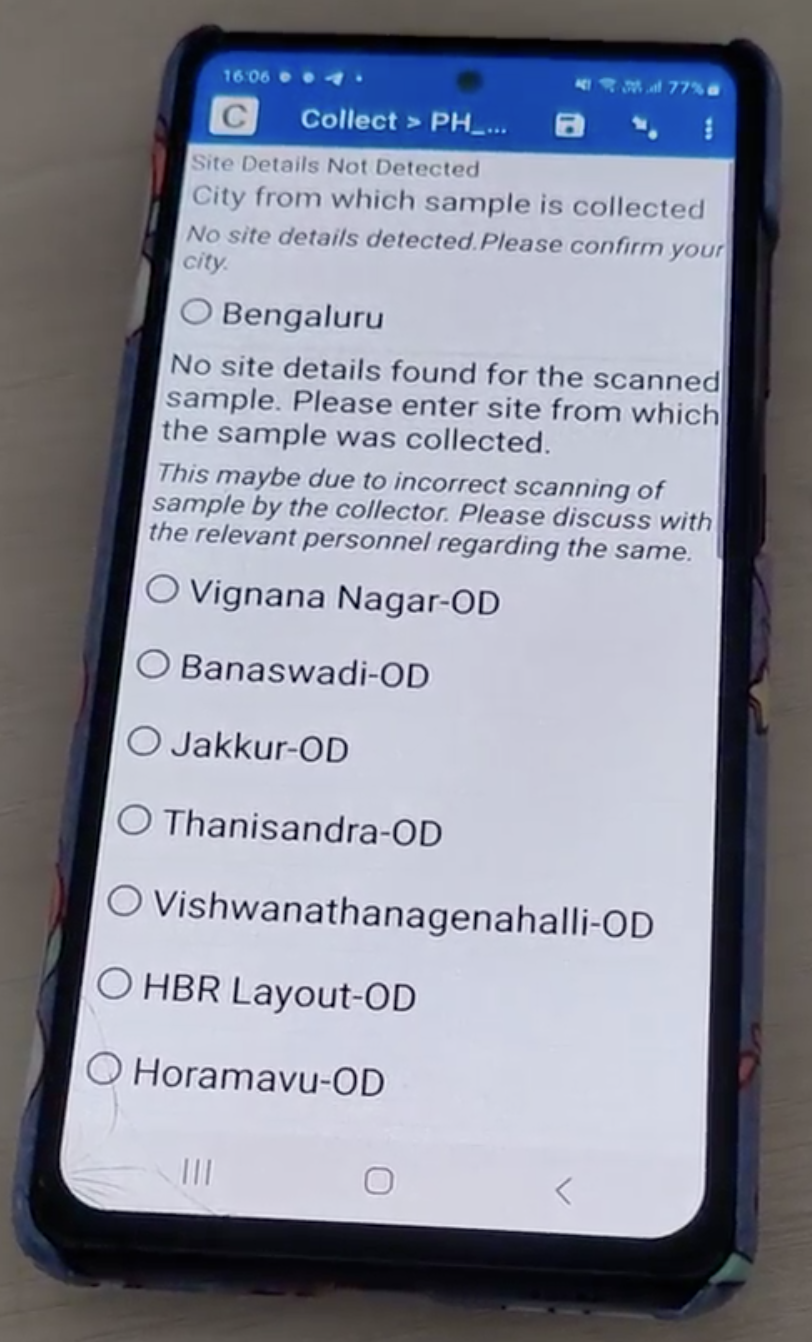
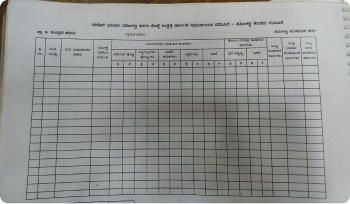
Fragmented data sources Manual spreadsheet tracking WhatsApp based reporting

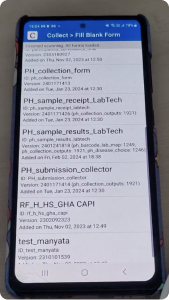
Sample data is collected and stored across multiple forms, Google Sheets, apps and WhatsApp chains — with no single source of truth.

ARTPARK’S BRIEF

To design an MVP to digitize & standardize legacy, manual processes & eliminate data fragmentation through a unified ecosystem for government officials, diagnostic labs & sample collectors.

PROJECT PROCESS

Where I stepped in

Project process timeline

I stepped in during the ‘Building from 0→1’ phase, where I had to absorb 6 weeks worth of research insights and analysis in a week to start with the design phase.

PRODUCT LEVEL HMWs

Framing the core system-level challenges before diving into user needs

Before looking at individual user journeys, we framed the overarching system challenges that would shape the entire platform architecture.

HMW 01

Unify & standardize a process & format of data collection & documentation across job roles?

HMW 02

Build flexibility to seamlessly switch between automated and manual data entry at different parts of the process?

HMW 03

Create a modular platform that adapts to different org structures & needs?

HMW 04

Accommodate varying data needs for tracking & reporting across roles & projects?

KEY STAKEHOLDERS

How does information flow?

We identified the main stakeholders and understood how information flows between each pillar.

Sample Collectors

Sample collectors visit dairy farms & sheds to collect environmental samples and send it to assigned labs

Lab Diagnosticians

Labs safely store the samples, test and generate reports

Data Consumers

Medical officers track & monitor disease data, report to higher officials

Admins & Super Admins

Project leads who set-up surveillance projects, onboard partners, monitors orgs & surveillance workflows

SOLUTIONS

Sample Collectors

INSIGHT 01

Tedious and inefficient data entry

Collectors find data entry long and tedious, often reverting to manual sheets when the app fails, leading to frustration.

HOW MIGHT WE

Ensure quick, efficient and error-free data entry for sample collectors who may lack context?

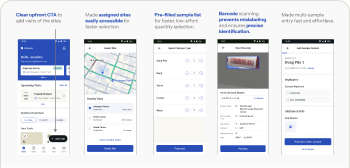
Sample collector flow
Sample collector flow — quick site selection, pre-filled samples, barcode scanning

INSIGHT 02

Lack of Process Context

Collectors may not always possess the appropriate context or knowledge about the process, which leads to errors

HOW MIGHT WE

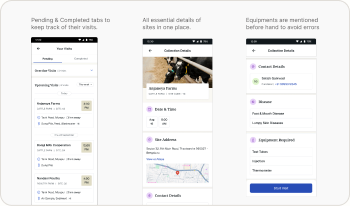
Better inform the collector of all collection & storage requirements to minimize error and maintain sample integrity?

Collection requirements guidance

SOLUTIONS

Lab Diagnosticians

INSIGHT 01

Inefficient Tracking of Samples

Updates or external communication is done manually through spreadsheets and emails. Keeping a track & storage is tedious.

HOW MIGHT WE

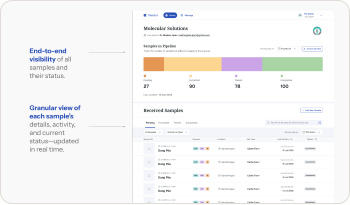
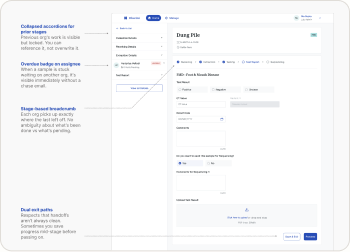
Enable labs to track and report critical milestones related to diagnostic processes and results?

Lab tracking dashboard

INSIGHT 02

Tedious and Inefficient Manual Data entry

Updates or external communication is done manually through spreadsheets and emails. Keeping a track & storage is tedious.

HOW MIGHT WE

Enable diagnosticians to quickly & efficiently document their task progress at each step of the process

Diagnostician task progress flow

SOLUTIONS

Data Consumers

INSIGHT 01

Hard-to-Track Disease Progress

Disjointed data sources and manual spreadsheets made generating insights slow and unreliable.

HOW MIGHT WE

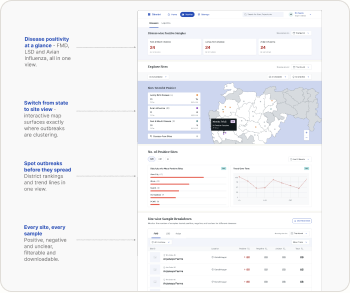
Enable users to track, and analyze report critical milestones related to the disease?

Disease progress tracking dashboard

INSIGHT 02

Scattered Tracking of ES Activities

Data fragmented across multiple tools — users have to refer to various reports, spreadsheets, emails & WhatsApp for sample updates, disease data analysis etc.

HOW MIGHT WE

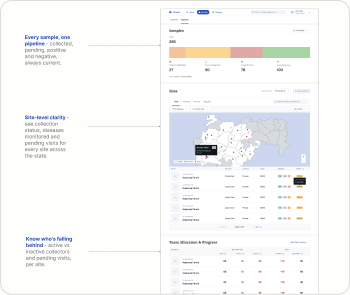
Provide better visibility to track all ES collection & diagnostic activities being carried out (end-to-end)?

ES activity visibility dashboard

SOLUTIONS

Admins & Super Admins

INSIGHT 01

Distributed Lab Operations

Testing & Sequencing activities aren’t always executed by one lab, sometimes it’s also outsourced to external orgs.

HOW MIGHT WE

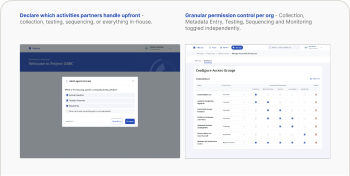
Create a modular platform that adapts to different org structures & needs?

Multi-org scoped access
Built for a multi-org reality — each partner declares their role, gets scoped access, and nothing bleeds across org boundaries.

INSIGHT 02

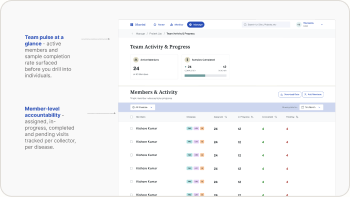
Lack of Visibility Into Team Progress

Admins can’t track subordinate progress in the app and must rely on scattered Google Sheets or email updates.

HOW MIGHT WE

Improve the admin visibility of tasks performed by all collection & lab users to help them monitor and inform ES processes

Admin team progress visibility

REFLECTION

Little wins from this project

✦

Ensured a frictionless design handoff, staying closely aligned with developers through full implementation.

✦

Demonstrated fast learning agility, quickly digesting deep research and shaping early solution directions.

✦

Felt the reward of designing with real societal impact, as the tools support government public health programs.

E2E Design of a unified ecosystem for Animal Disease Monitoring for India

Animal disease monitoring dashboard product shot

MY ROLE

Product Designer

DURATION

4 Months

TEAM

Anushka G · Ria G · Me

CLIENT

ARTPARK × Parallel

CONTEXT

India has lost thousands of livestock due to preventable diseases

India’s dairy sector is smallholder-dominated — roughly 75% of rural households keep 2–4 animals, and small/marginal farmers hold 60% of female cattle and buffaloes. Foot & Mouth Disease (FMD) affecting even one animal can significantly dent household income.

In 2021, India saw 19,363 FMD attacks across 116 districts.

2M+

Cattle Affected

97k+

Deaths across 15 states

Context supporting image

PROBLEM

No centralised system to monitor animal diseases

Currently the government has no centralised system to monitor animal diseases like FMD & LSD. The surveillance of these diseases is initiated by multiple stakeholders and is fragmented across geographies and organisations.

This leads to loss of data and delays in initiating vaccine drives.
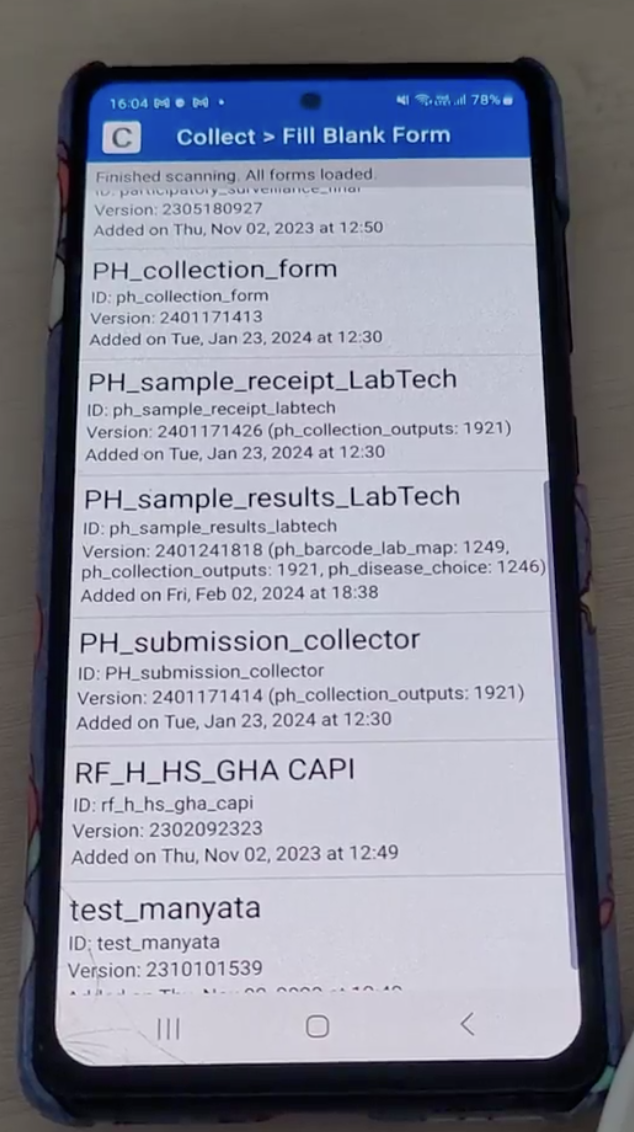
Fragmented data sources
Manual spreadsheet tracking
WhatsApp based reporting

Sample data is collected and stored across multiple forms, Google Sheets, apps and WhatsApp chains — with no single source of truth.

ARTPARK’S BRIEF

To design an MVP to digitize & standardize legacy, manual processes & eliminate data fragmentation through a unified ecosystem for government officials, diagnostic labs & sample collectors.

PROJECT PROCESS

Where I stepped in

Project process timeline

I stepped in during the ‘Building from 0→1’ phase, where I had to absorb 6 weeks worth of research insights and analysis in a week to start with the design phase.

PRODUCT LEVEL HMWs

Framing the core system-level challenges before diving into user needs

HMW 01

Unify & standardize a process & format of data collection & documentation across job roles?

HMW 02

Build flexibility to seamlessly switch between automated and manual data entry at different parts of the process?

HMW 03

Create a modular platform that adapts to different org structures & needs?

HMW 04

Accommodate varying data needs for tracking & reporting across roles & projects?

KEY STAKEHOLDERS

How does information flow?

We identified the main stakeholders and understood how information flows between each pillar.

Sample Collectors

Sample collectors visit dairy farms & sheds to collect environmental samples and send it to assigned labs.

Lab Diagnosticians

Labs safely store the samples, test and generate reports.

Data Consumers

Medical officers track & monitor disease data, report to higher officials.

Admins & Super Admins

Project leads who set-up surveillance projects, onboard partners, monitors orgs & surveillance workflows.

SOLUTIONS

Sample Collectors

INSIGHT 01

Tedious and inefficient data entry

Collectors find data entry long and tedious, often reverting to manual sheets when the app fails, leading to frustration.

HOW MIGHT WE

Ensure quick, efficient and error-free data entry for sample collectors who may lack context?
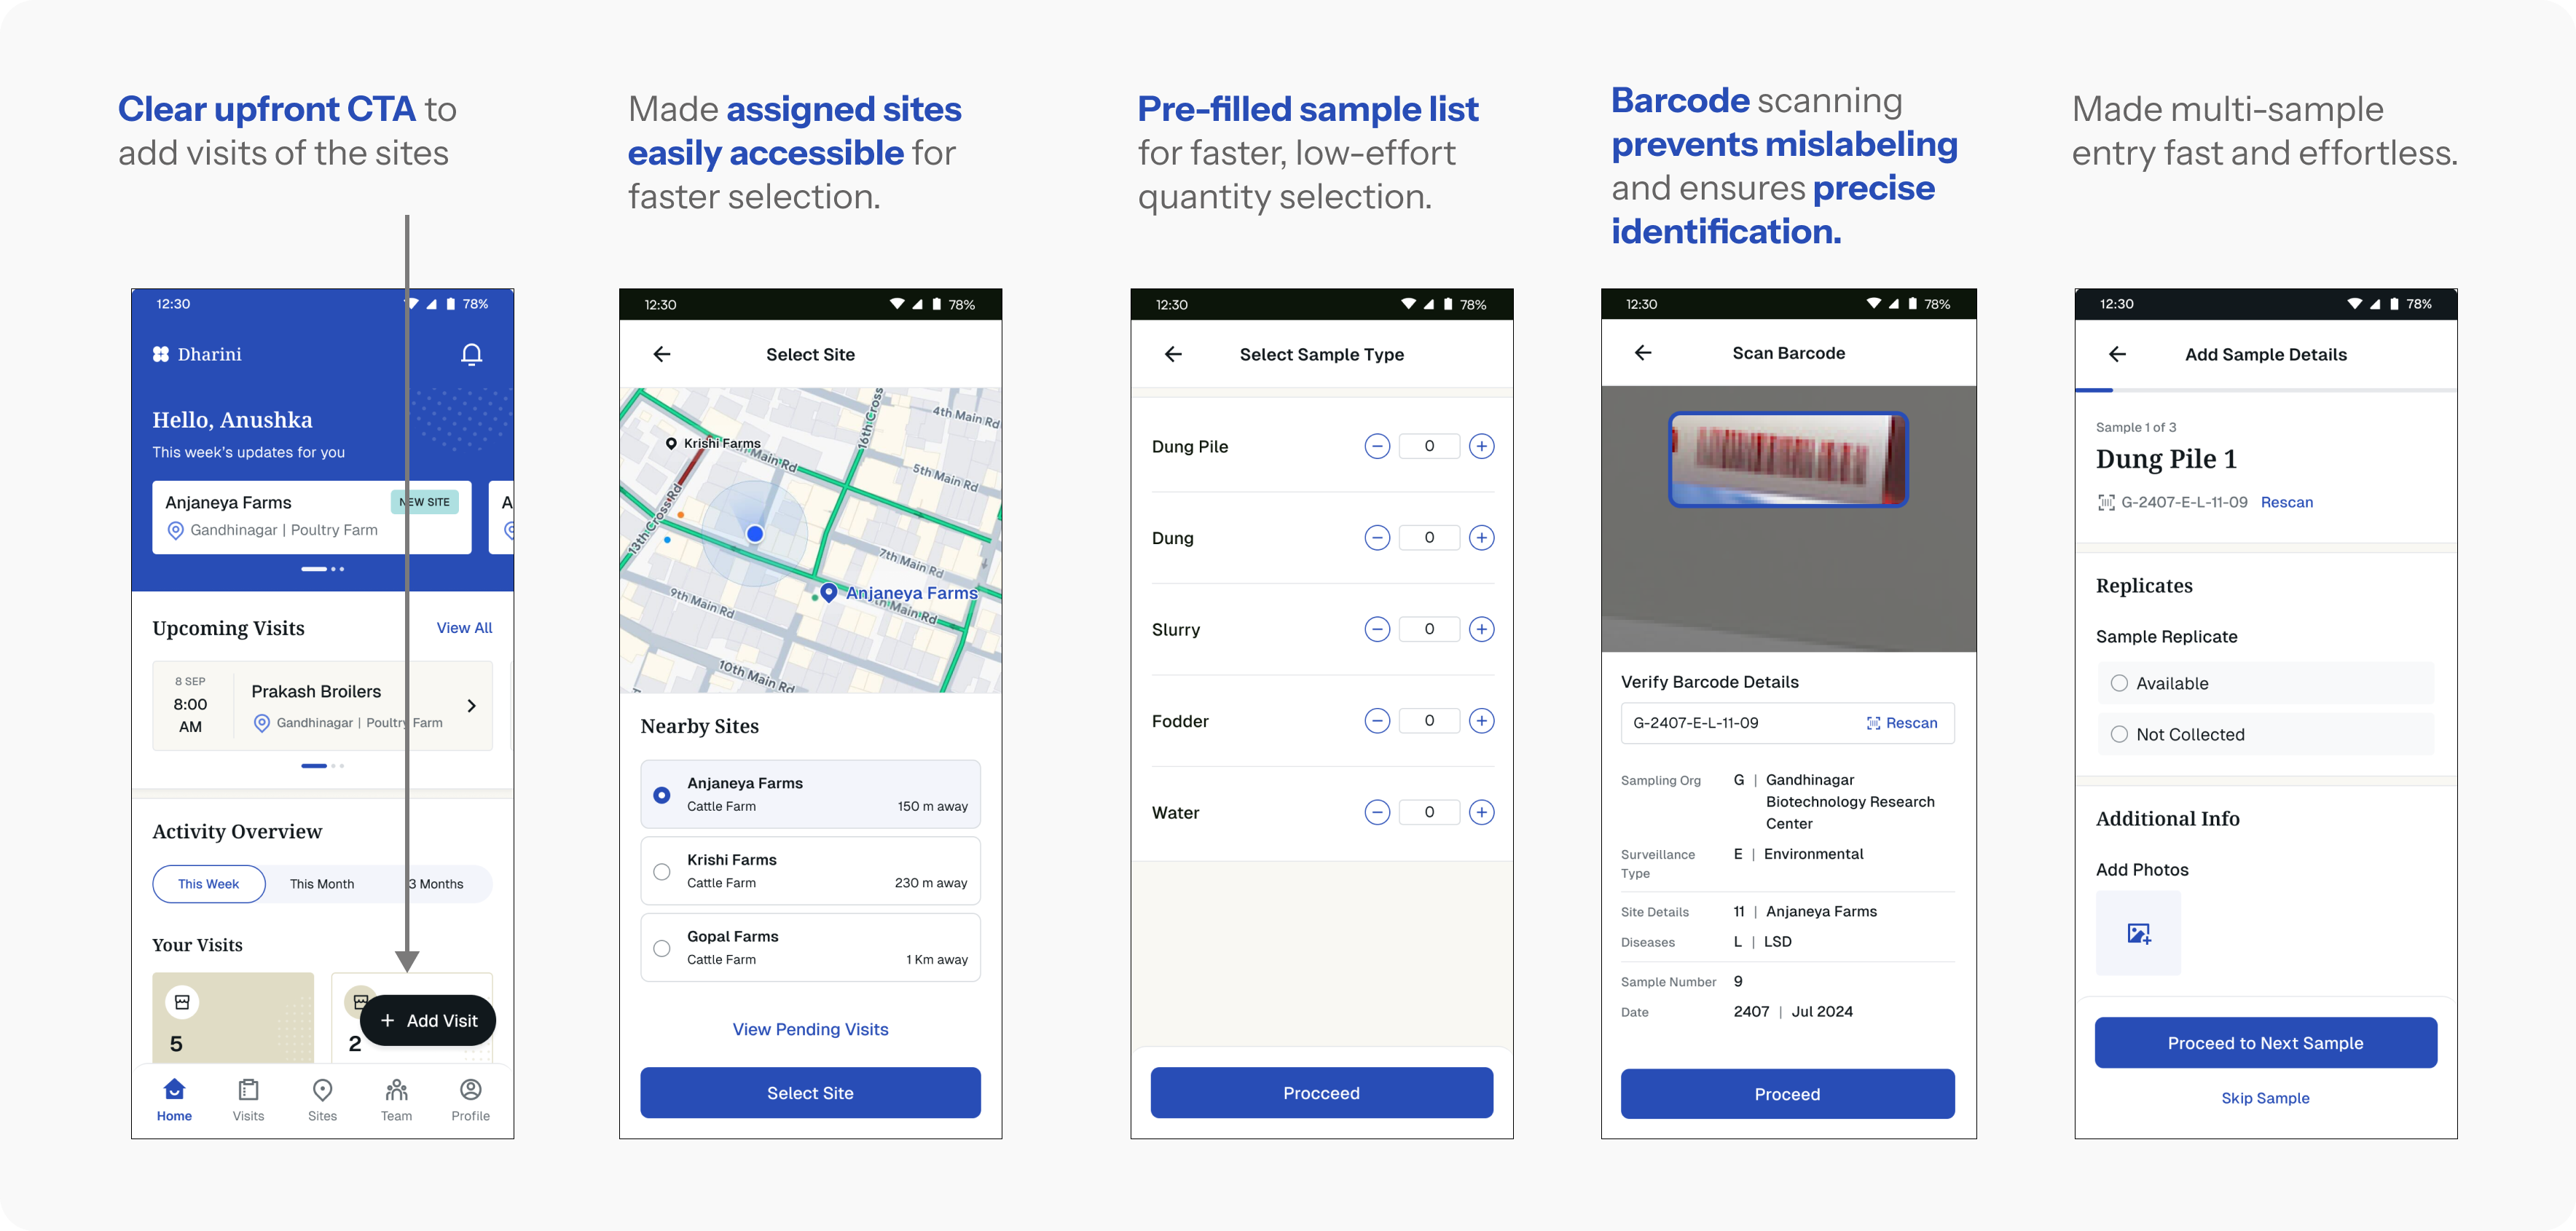
Sample collector flow

Sample collector flow — quick site selection, pre-filled samples, barcode scanning

INSIGHT 02

Lack of Process Context

Collectors may not always possess the appropriate context or knowledge about the process, which leads to errors.

HOW MIGHT WE

Better inform the collector of all collection & storage requirements to minimize error and maintain sample integrity?
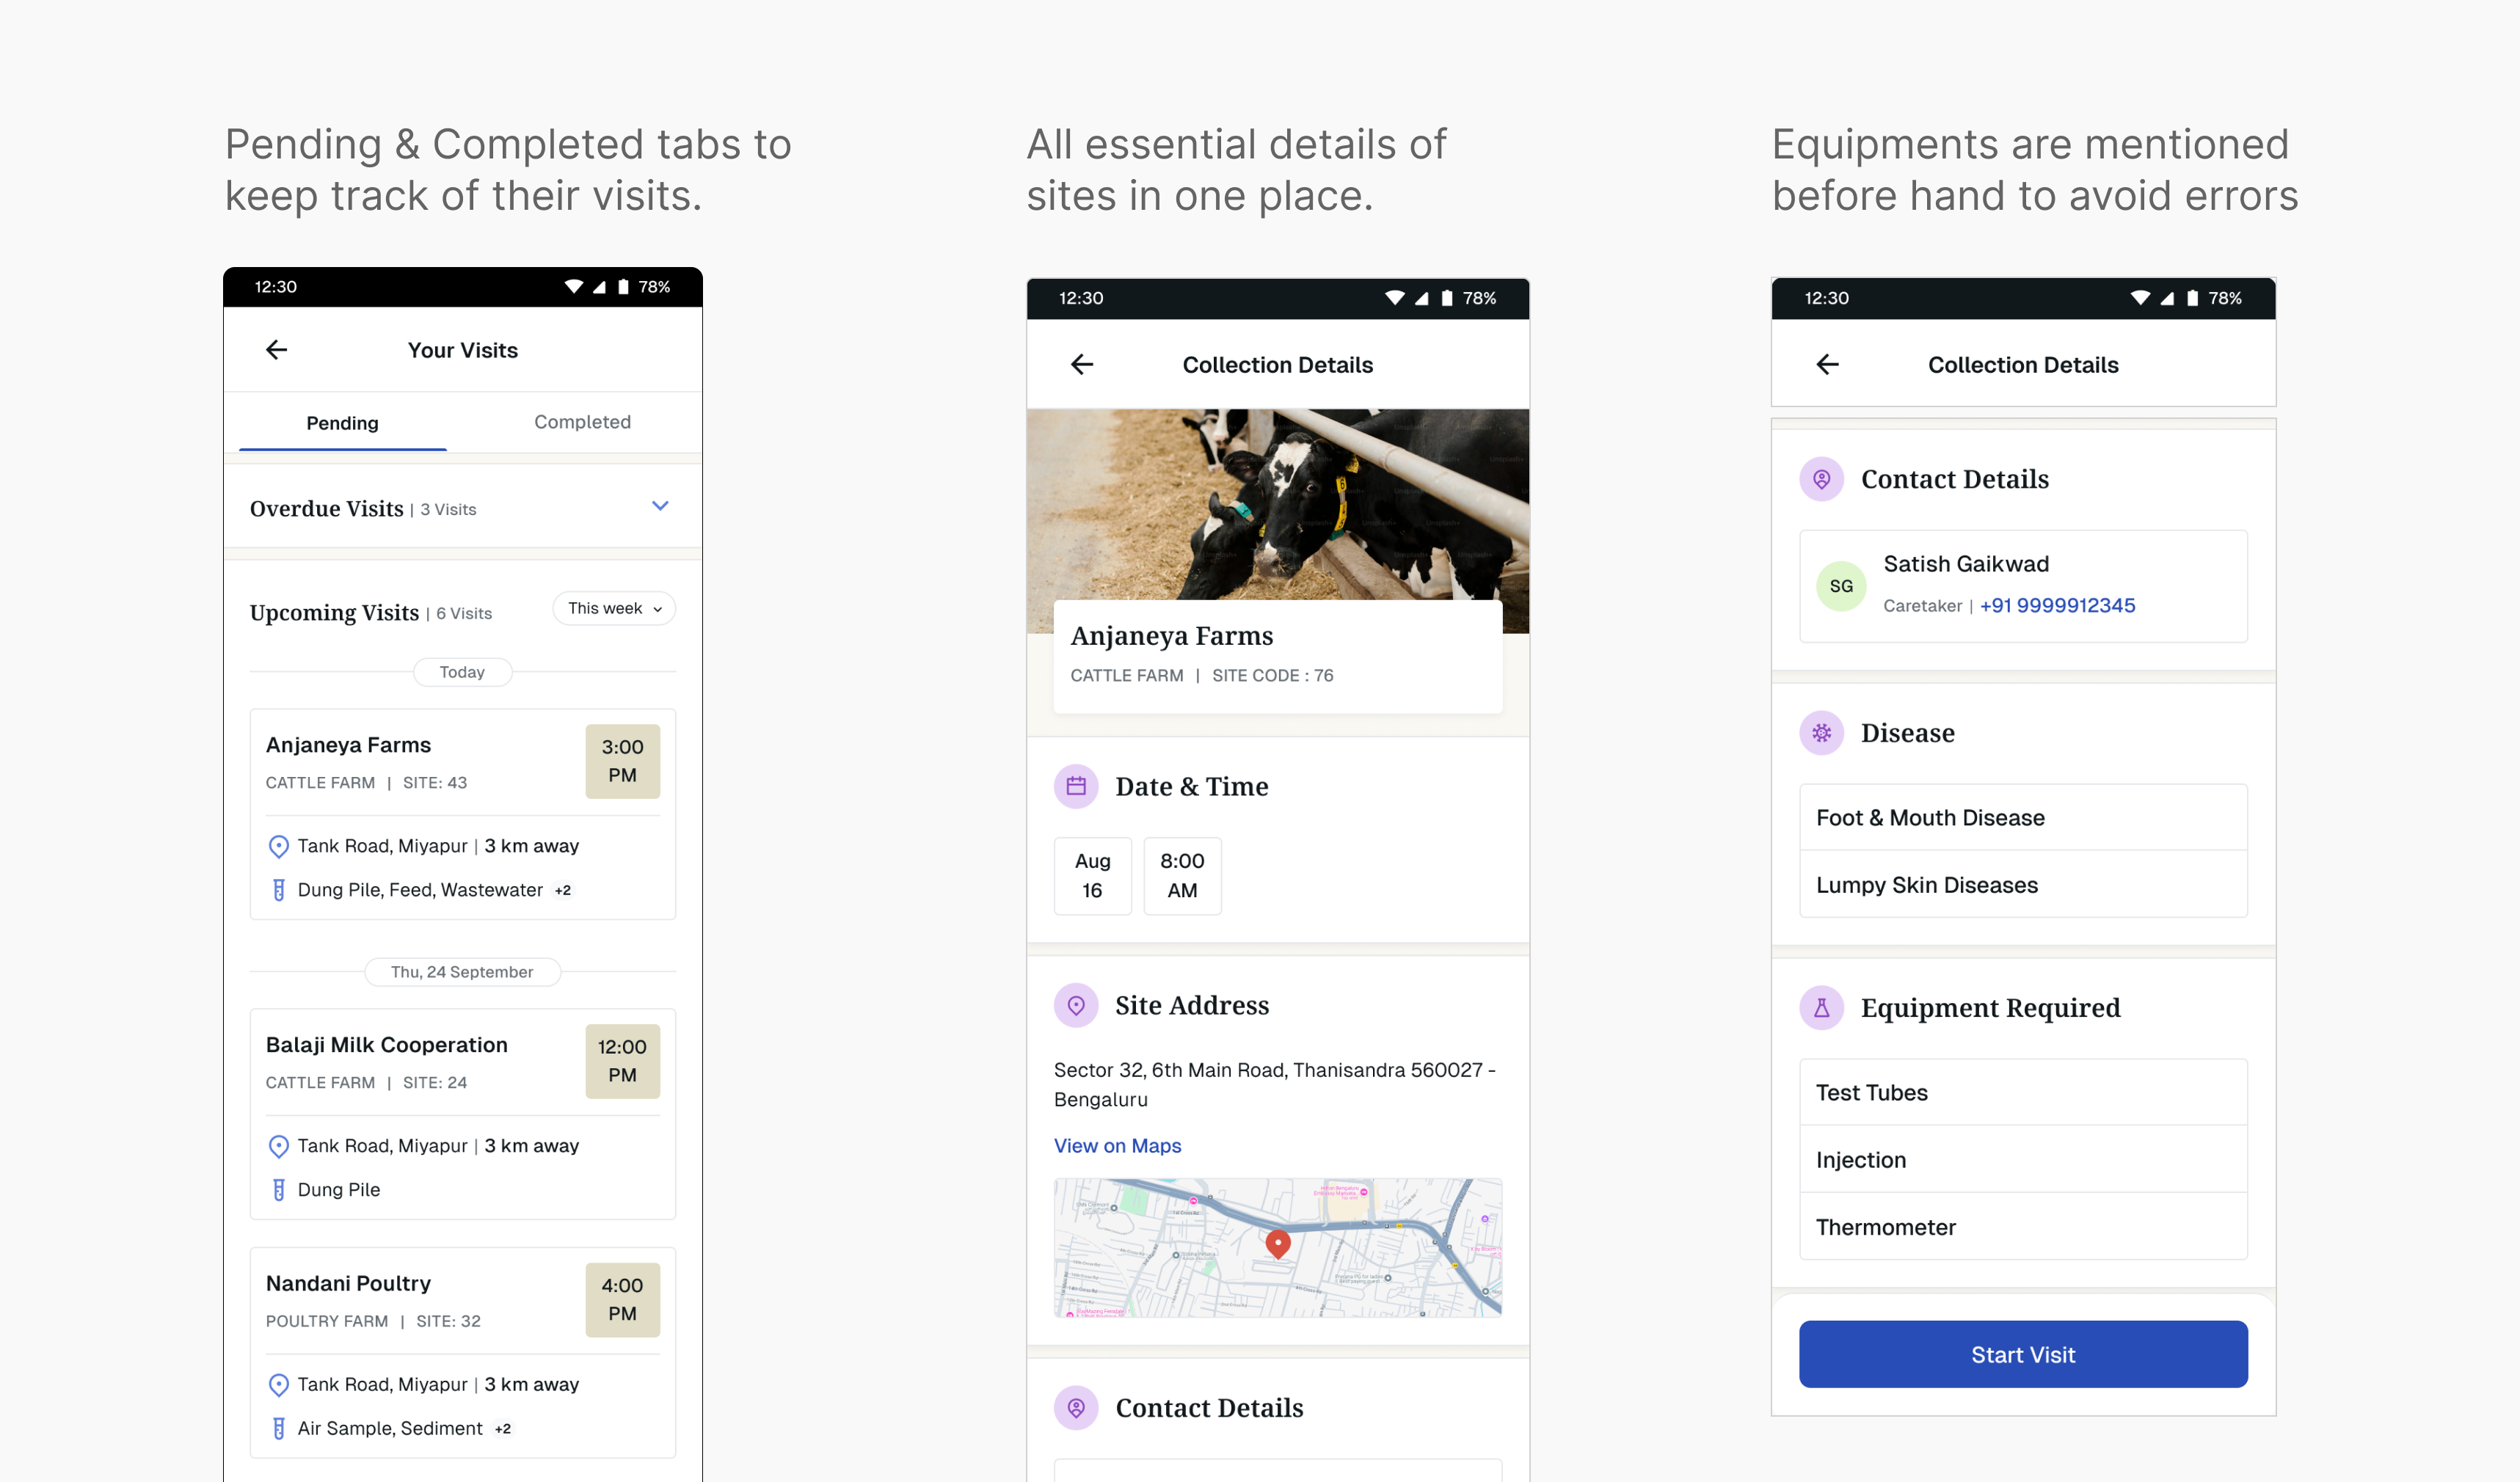
Collection requirements guidance

SOLUTIONS

Lab Diagnosticians

INSIGHT 01

Inefficient Tracking of Samples

Updates or external communication is done manually through spreadsheets and emails. Keeping a track & storage is tedious.

HOW MIGHT WE

Enable labs to track and report critical milestones related to diagnostic processes and results?
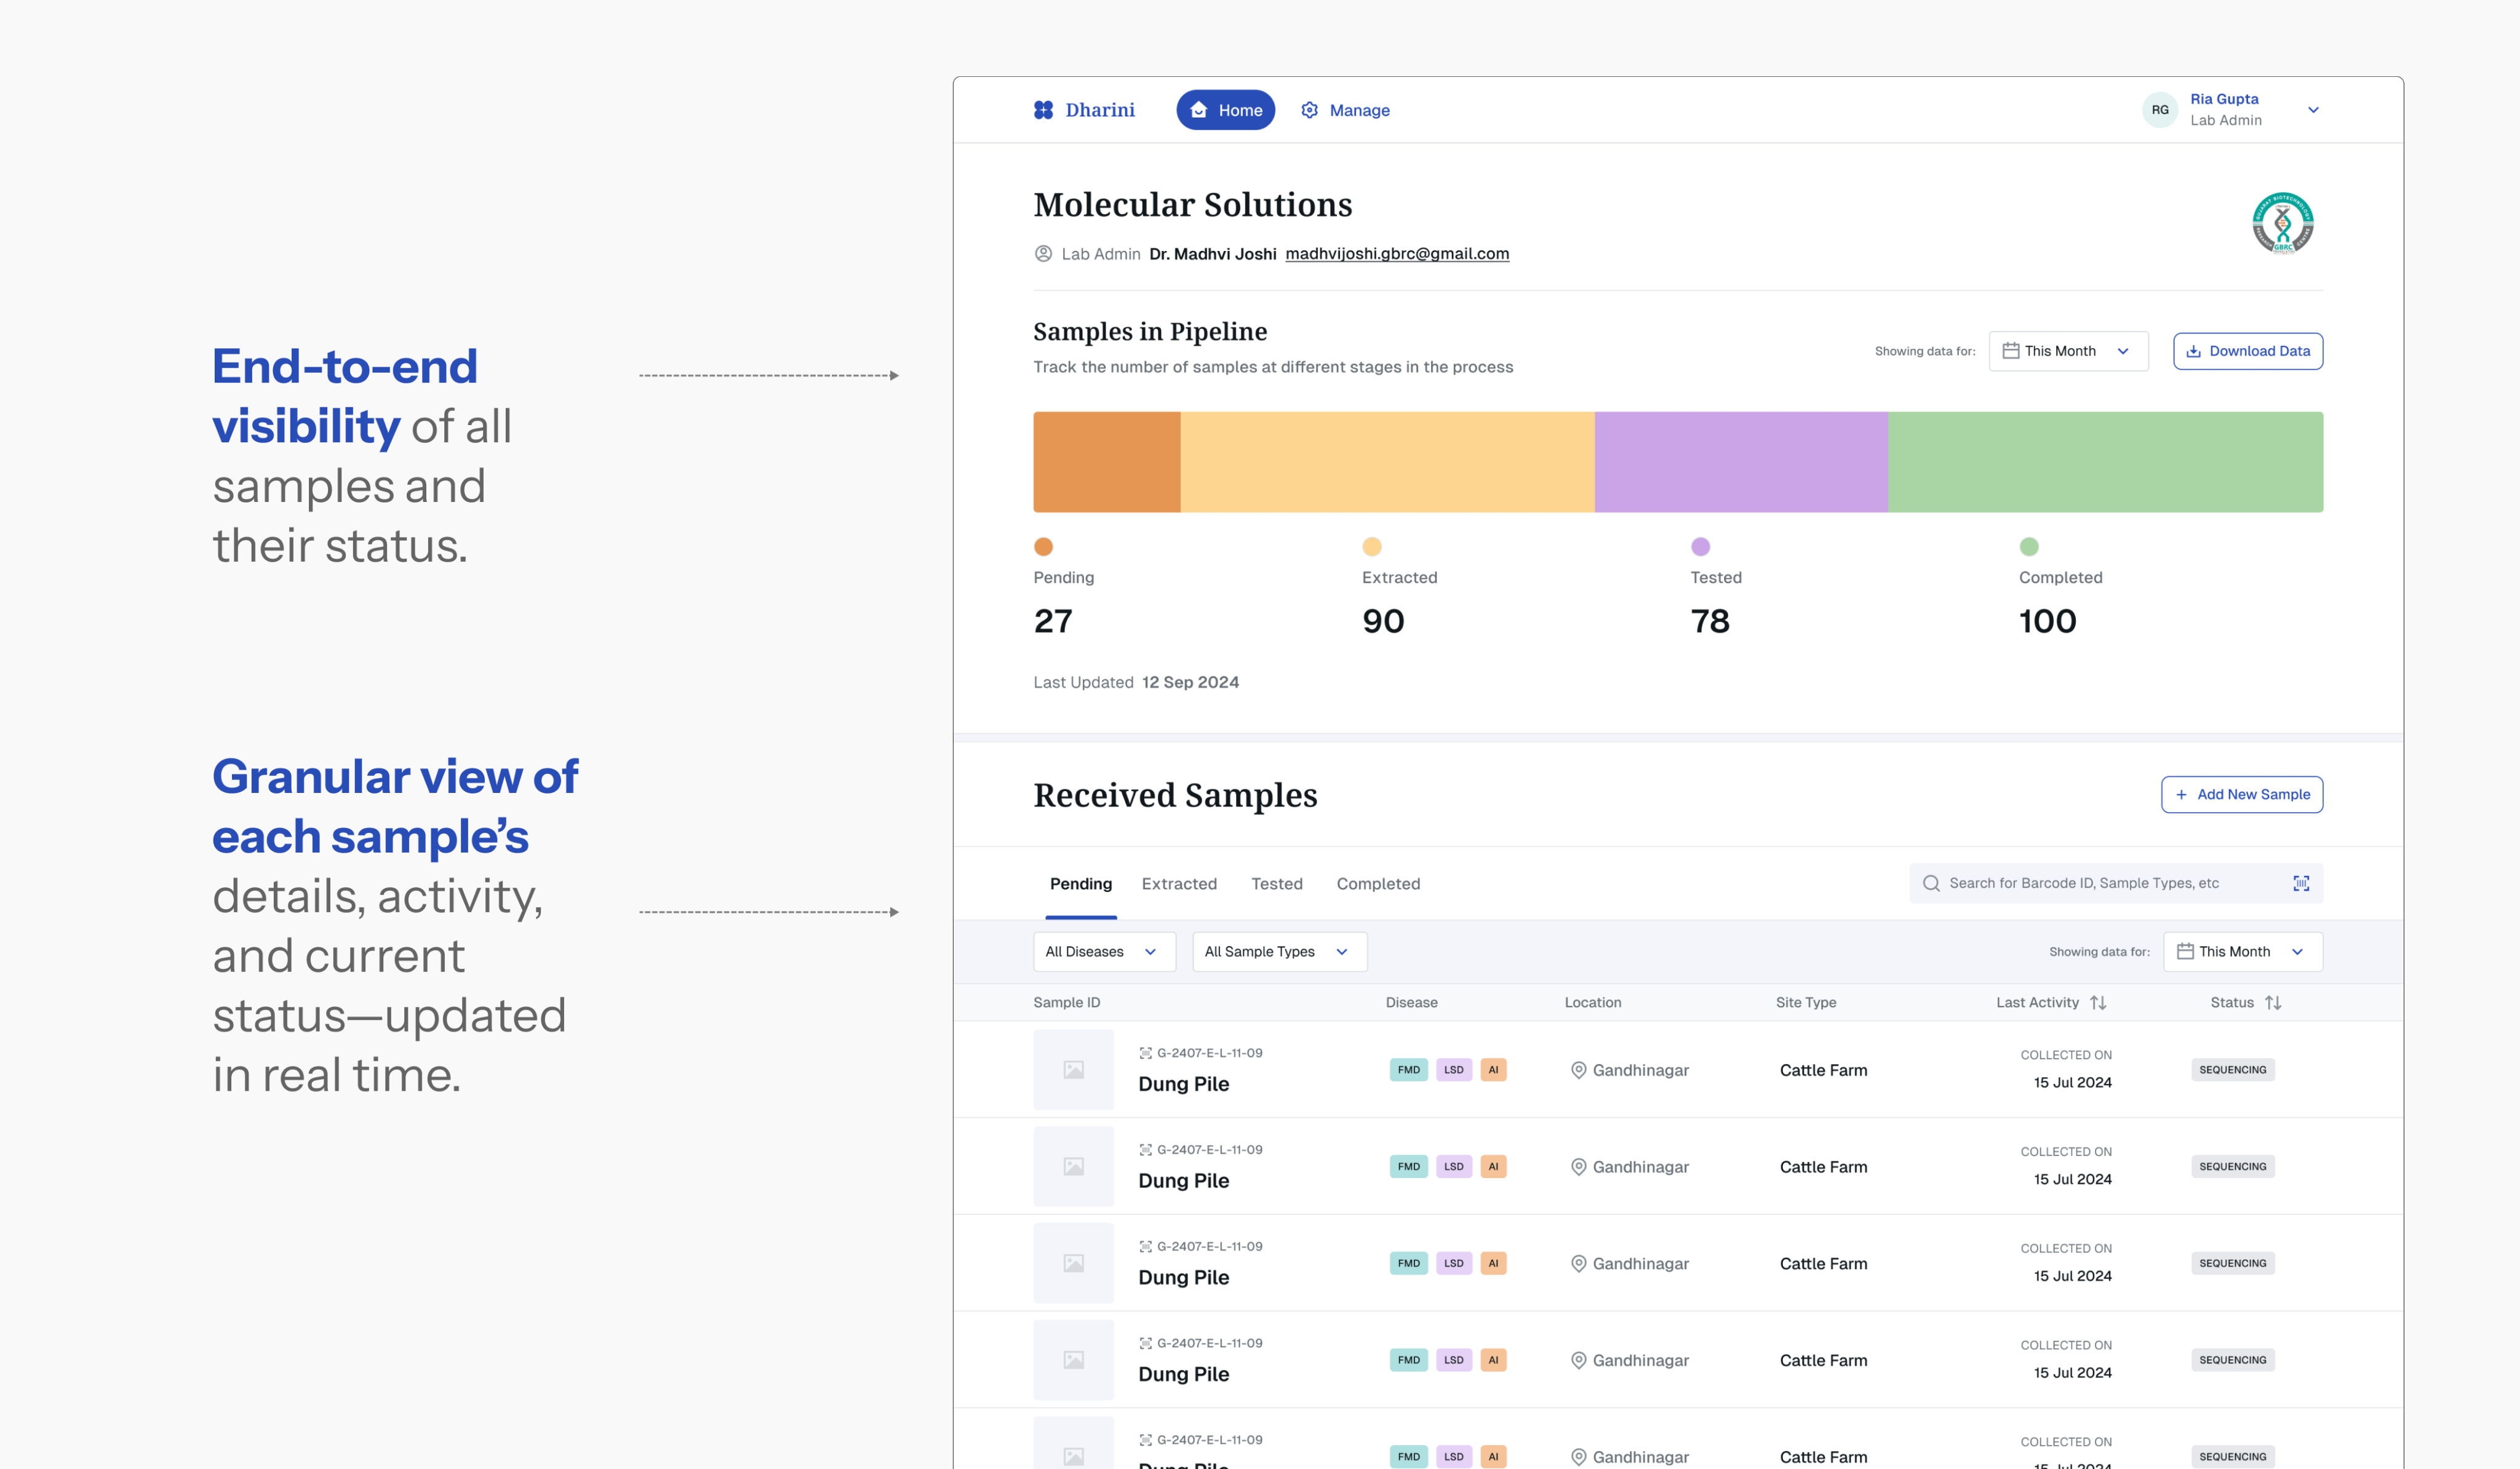
Lab tracking dashboard

INSIGHT 02

Tedious and Inefficient Manual Data entry

Updates or external communication is done manually through spreadsheets and emails. Keeping a track & storage is tedious.

HOW MIGHT WE

Enable diagnosticians to quickly & efficiently document their task progress at each step of the process
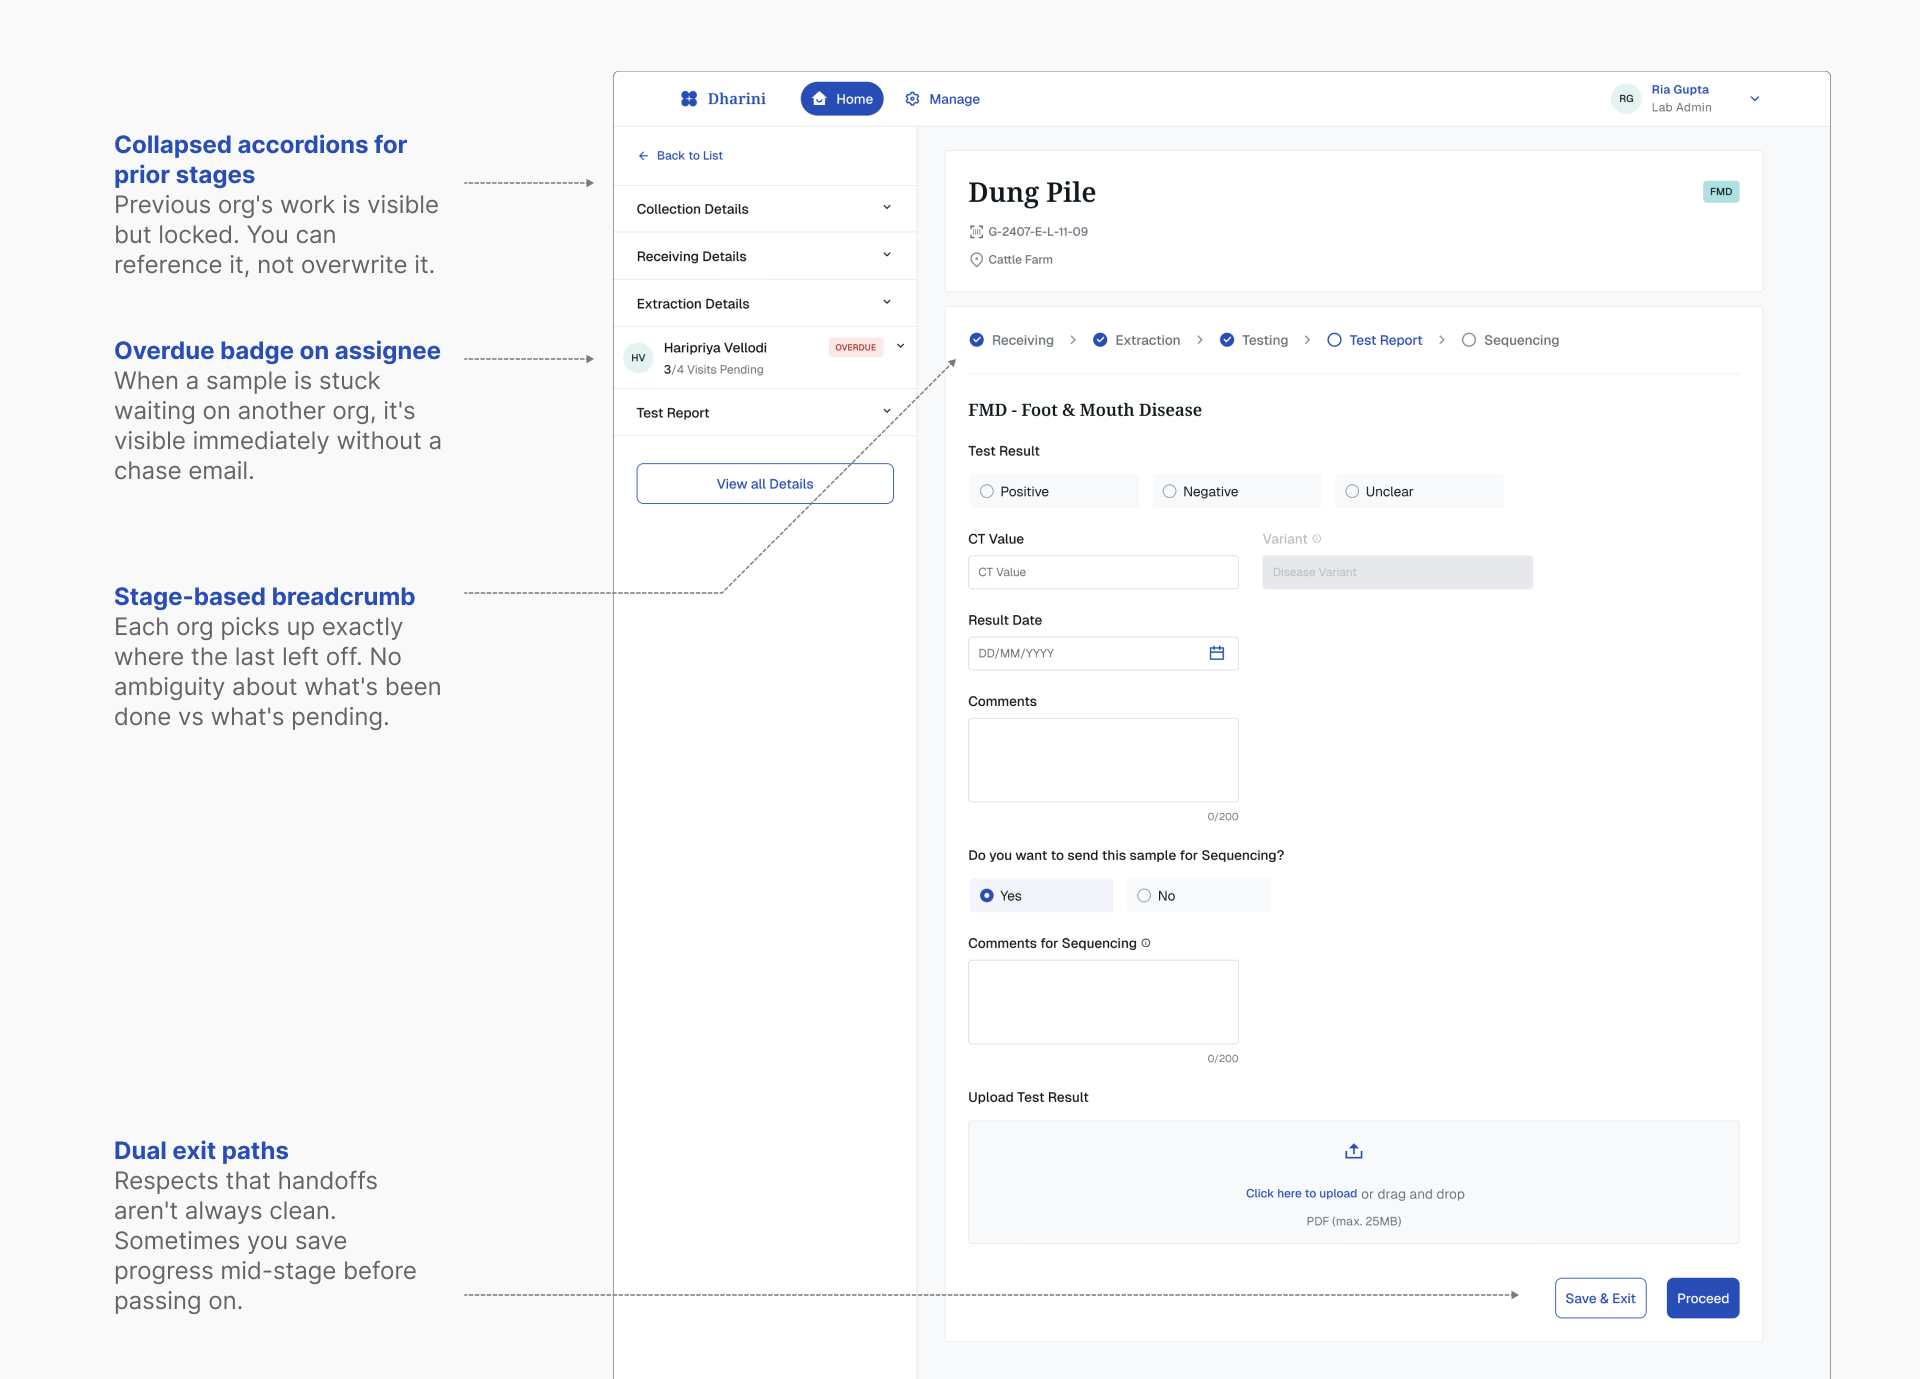
Diagnostician task progress flow

SOLUTIONS

Data Consumers

INSIGHT 01

Hard-to-Track Disease Progress

Disjointed data sources and manual spreadsheets made generating insights slow and unreliable.

HOW MIGHT WE

Enable users to track, and analyze report critical milestones related to the disease?
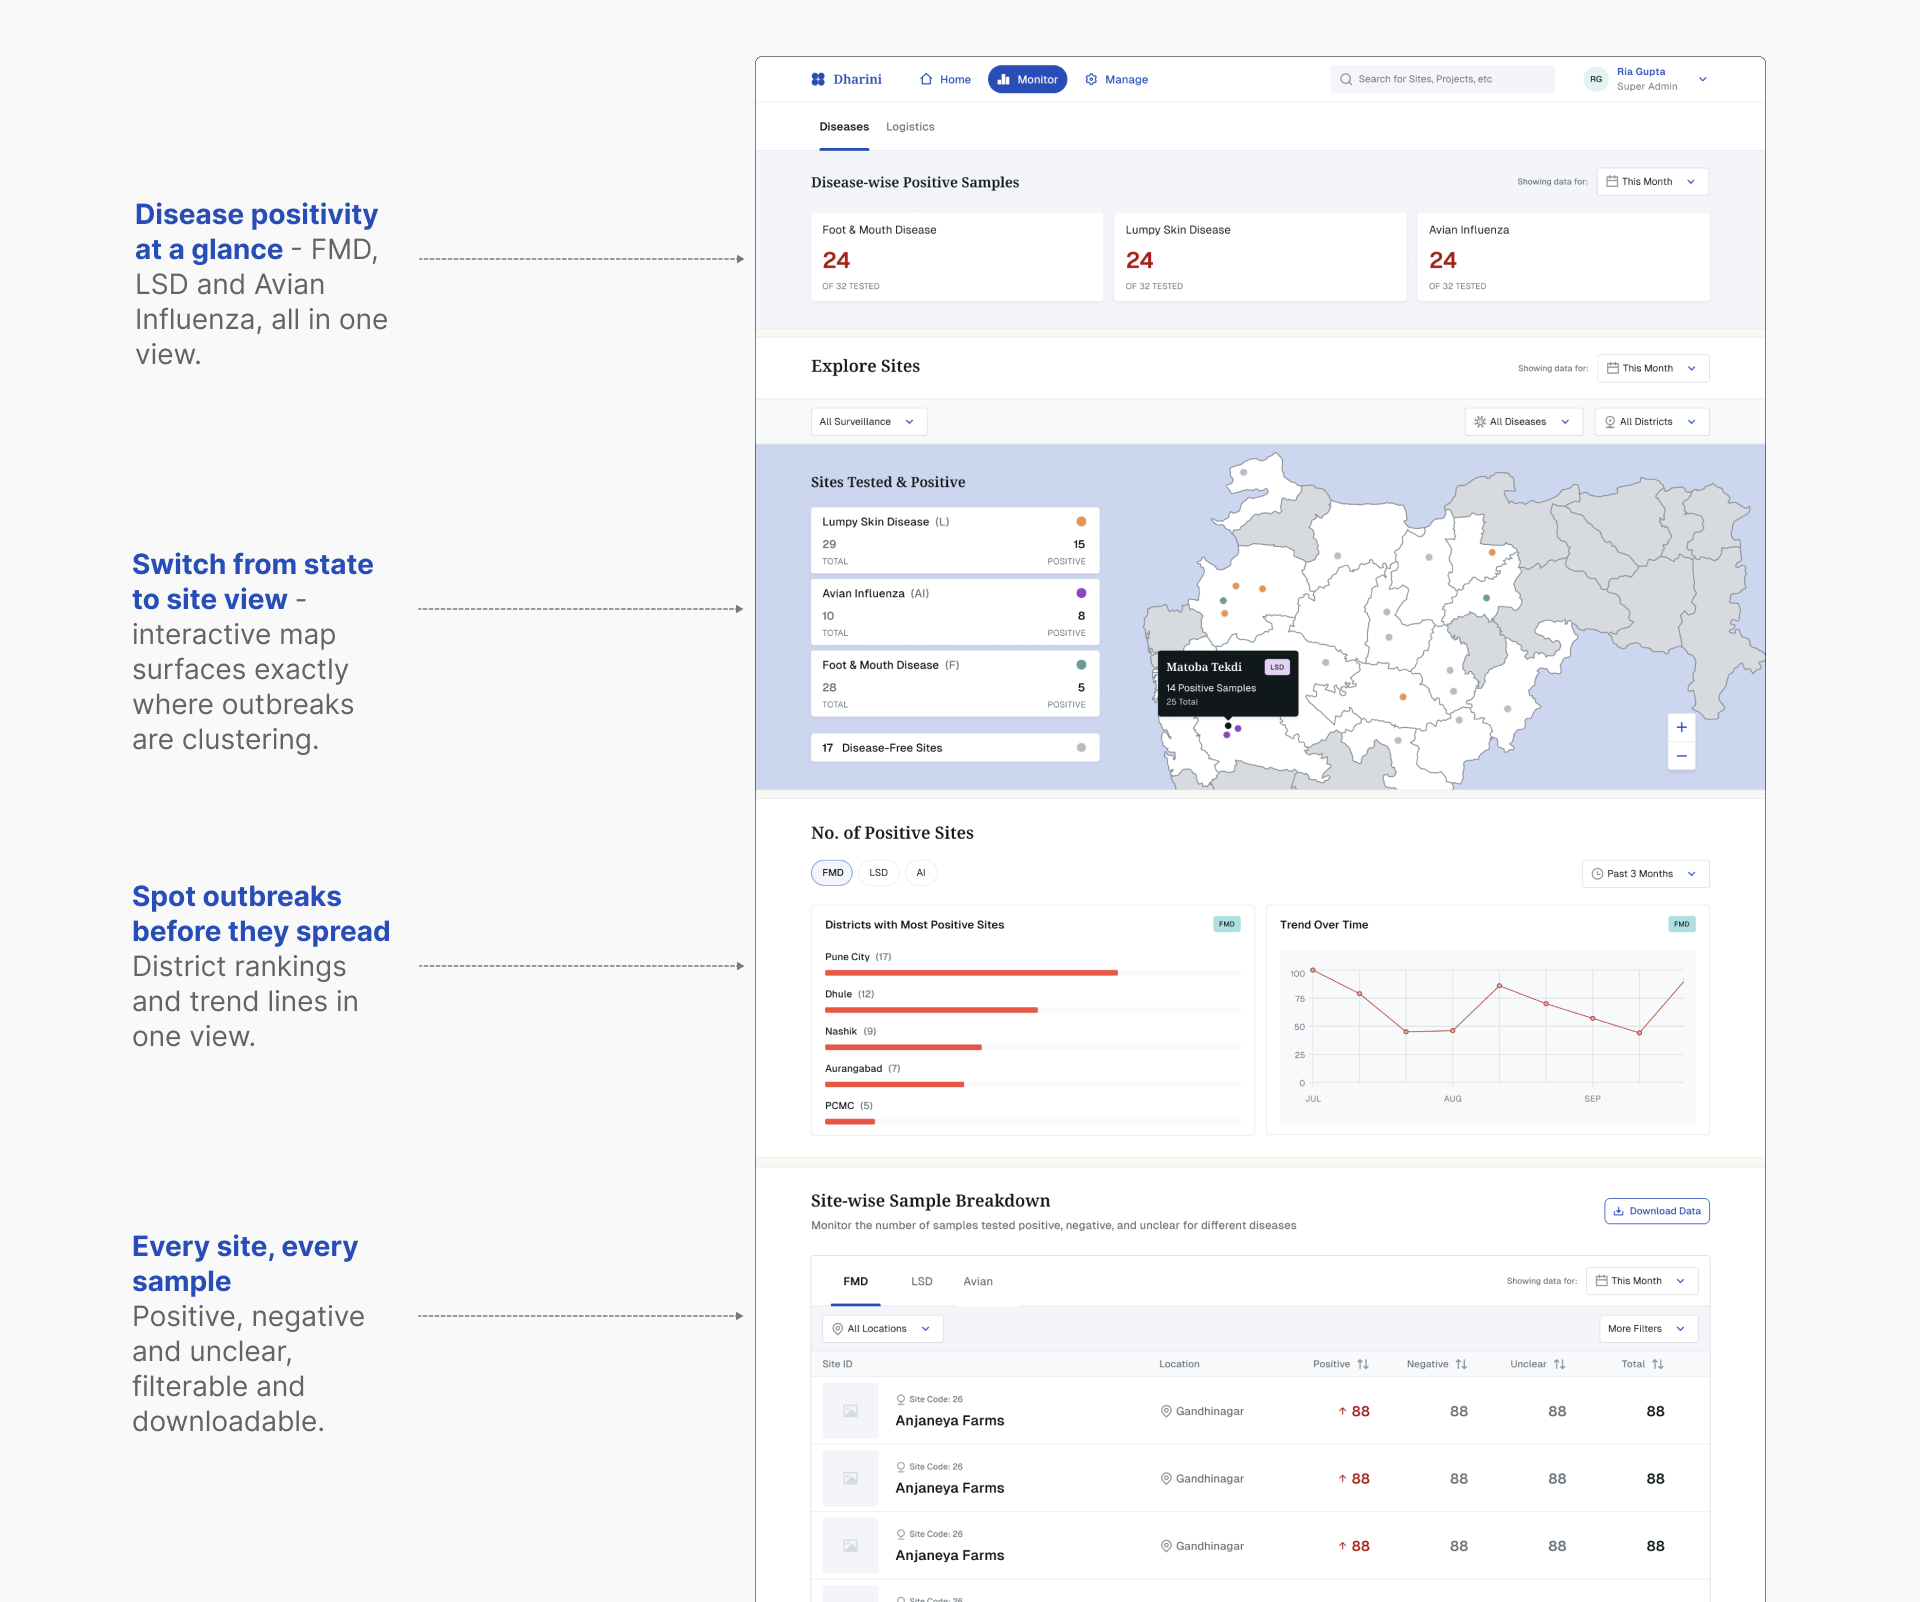
Disease progress tracking dashboard

INSIGHT 02

Scattered Tracking of ES Activities

Data fragmented across multiple tools — users have to refer to various reports, spreadsheets, emails & WhatsApp for sample updates, disease data analysis etc.

HOW MIGHT WE

Provide better visibility to track all ES collection & diagnostic activities being carried out (end-to-end)?
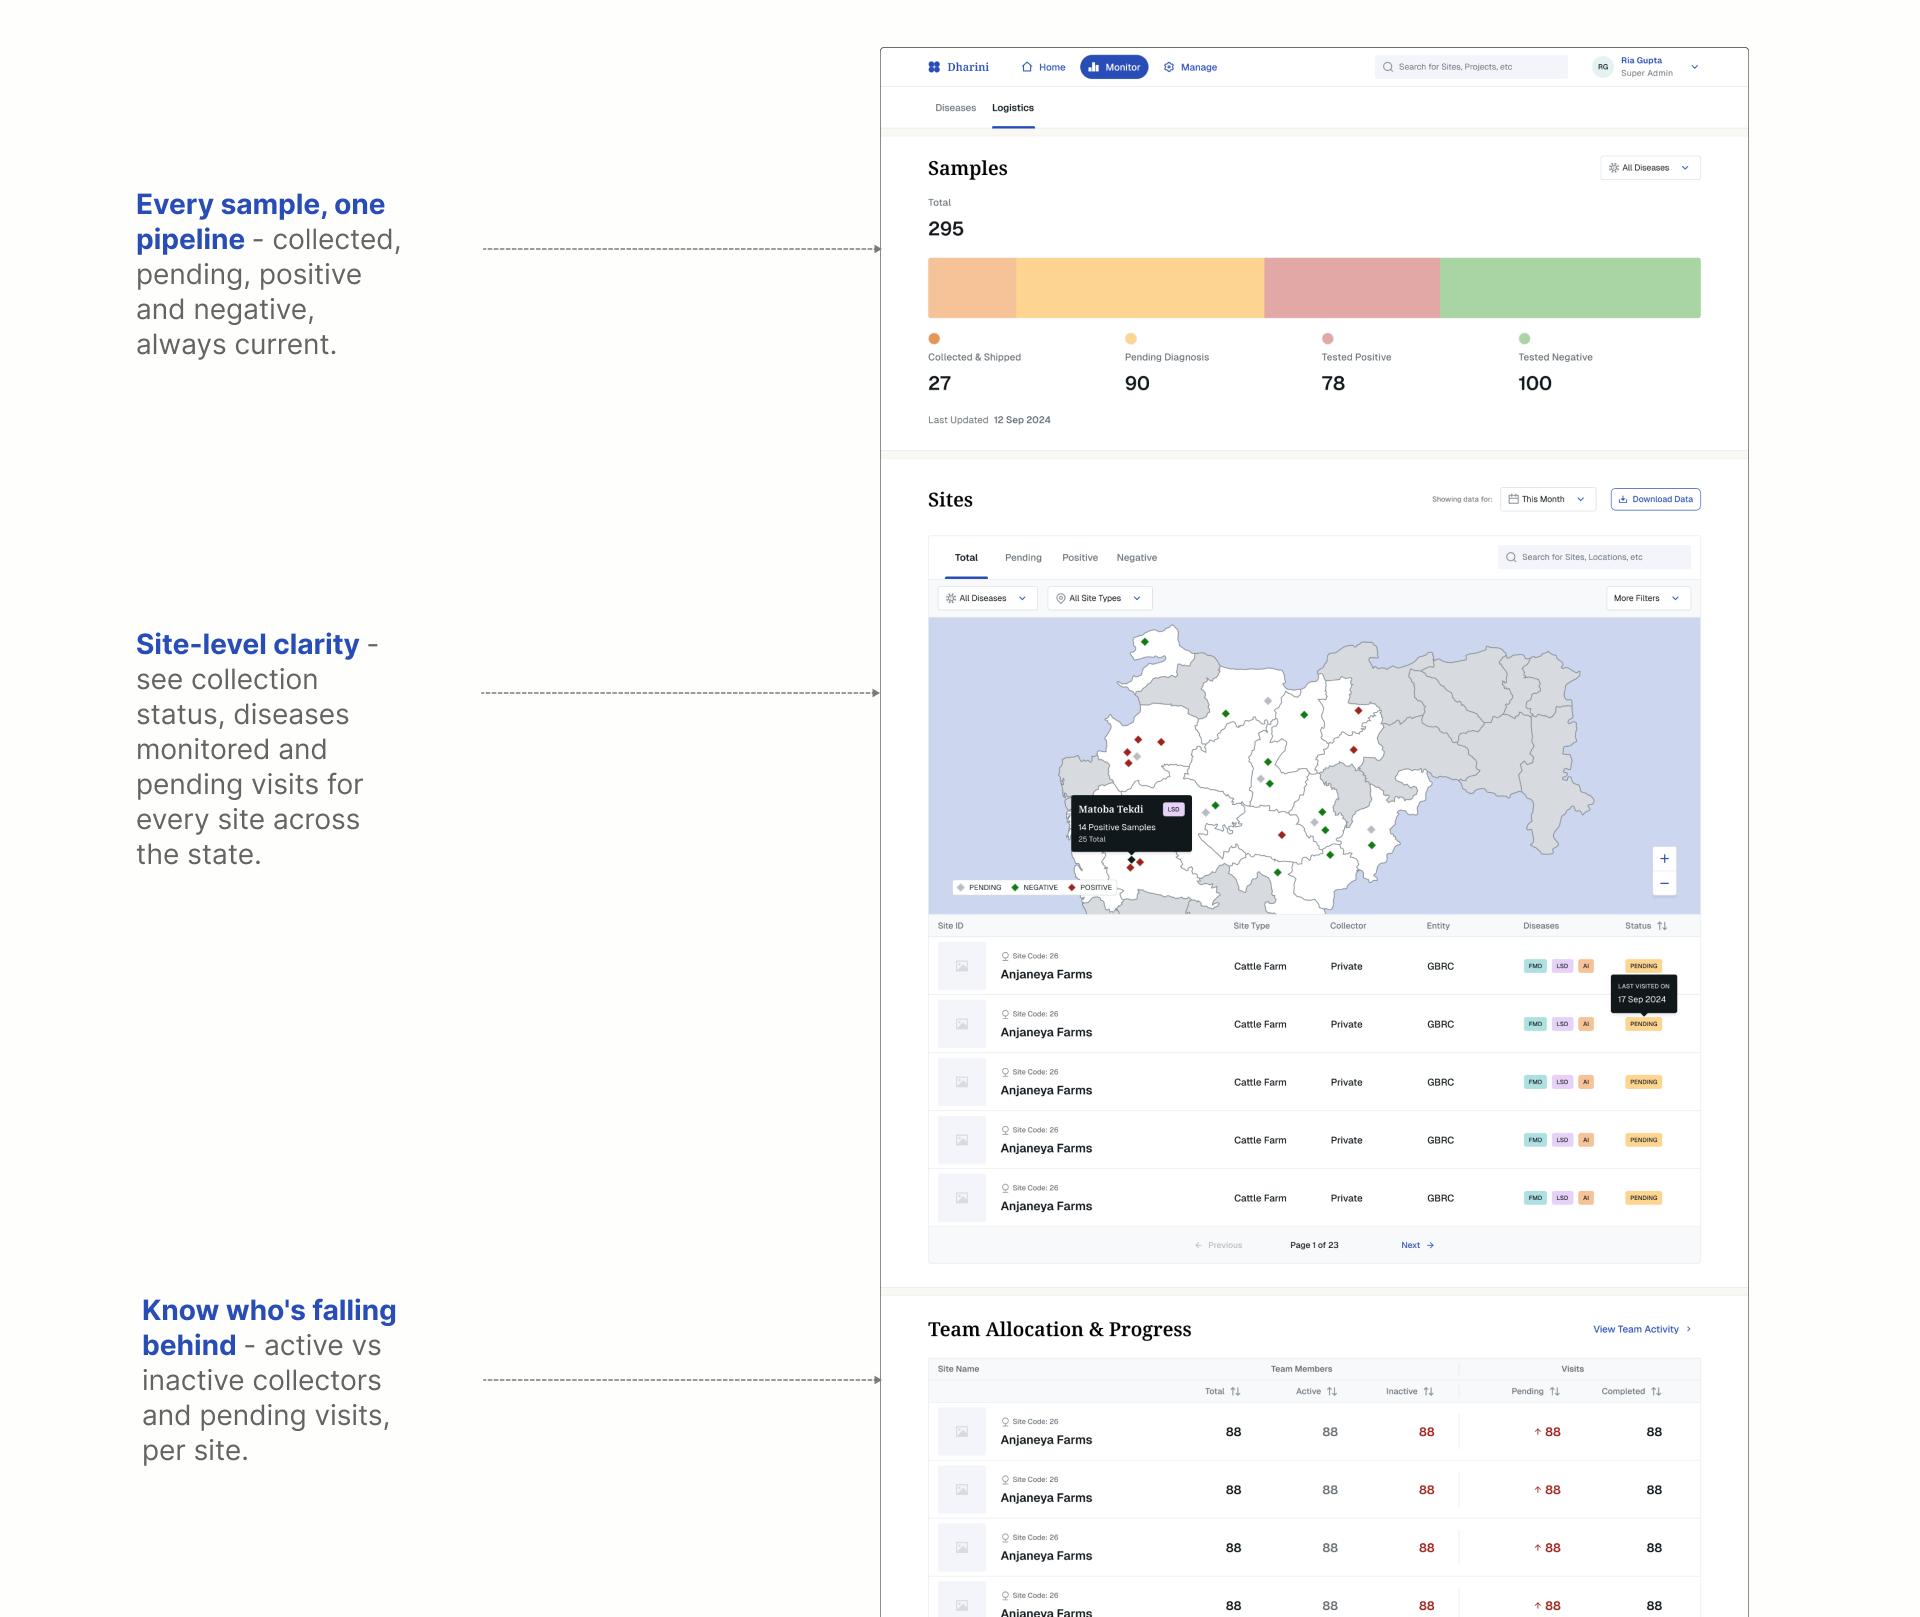
ES activity visibility dashboard

ORGANISATIONAL MODULARITY

Admins & Super Admins

INSIGHT 01

Distributed Lab Operations

Testing & Sequencing activities aren’t always executed by one lab, sometimes it’s also outsourced to external orgs.

HOW MIGHT WE

Create a modular platform that adapts to different org structures & needs?
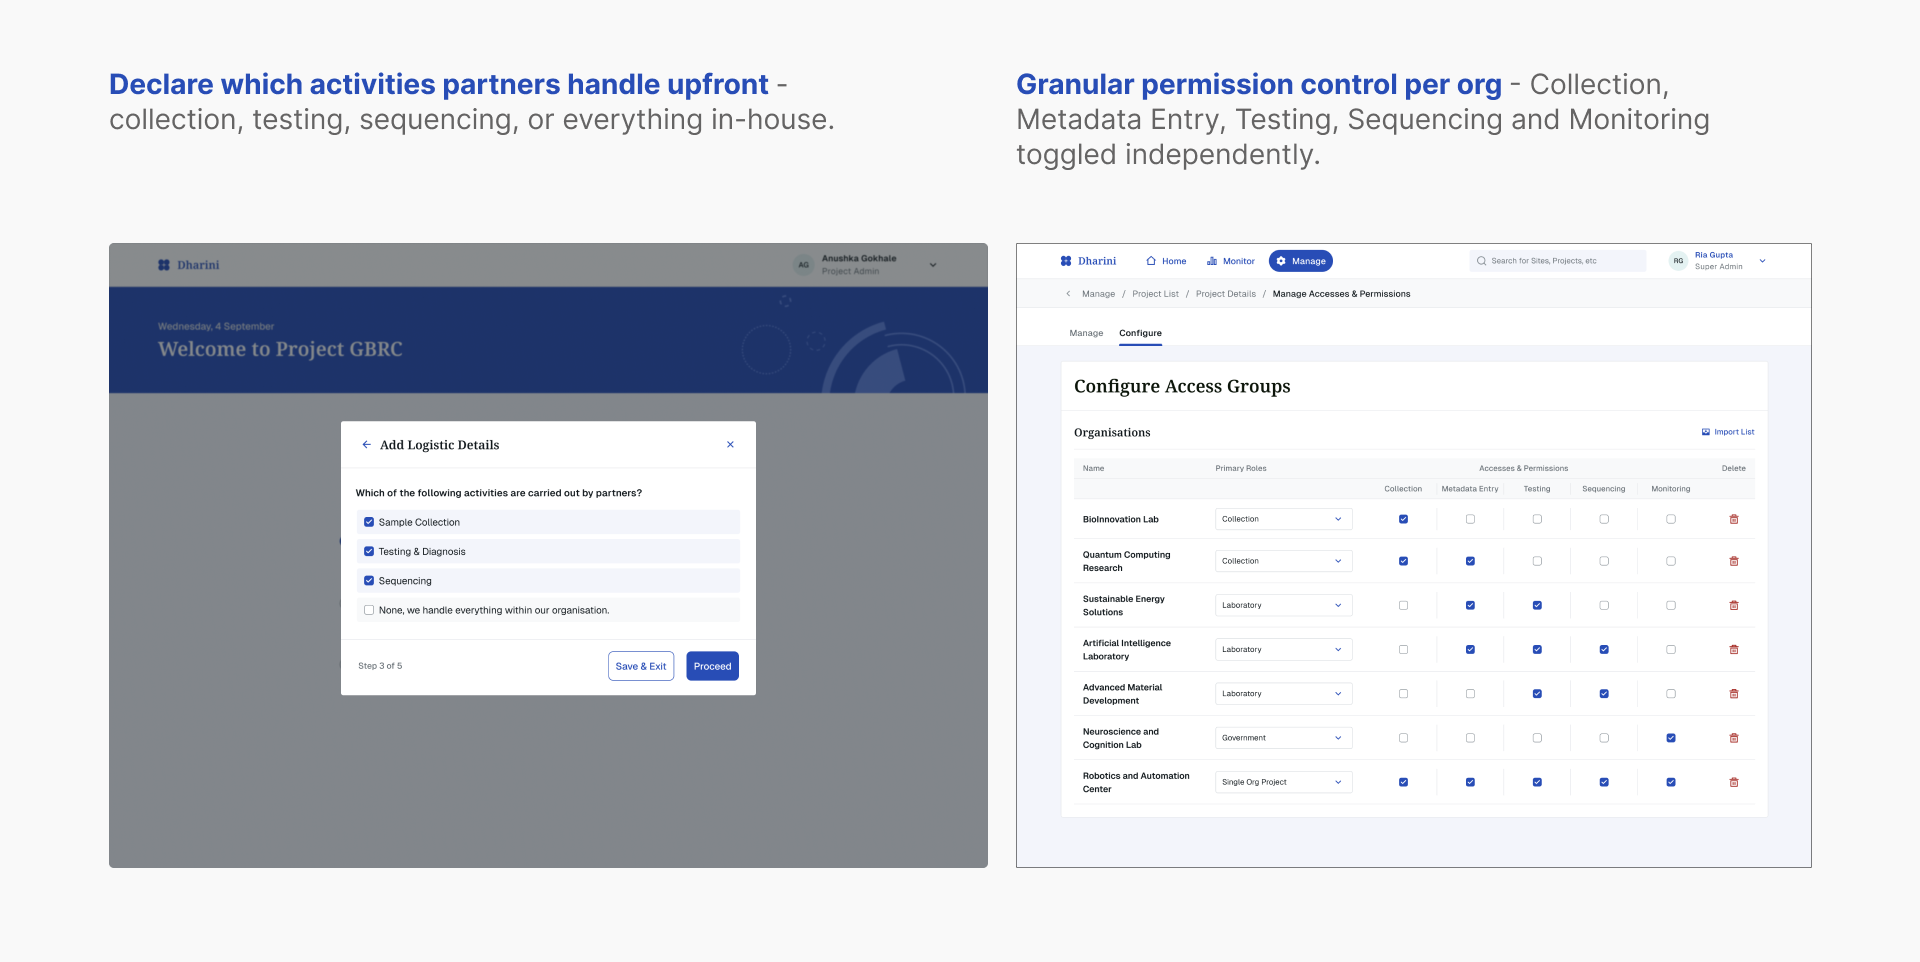
Multi-org scoped access

Built for a multi-org reality — each partner declares their role, gets scoped access, and nothing bleeds across org boundaries.

INSIGHT 02

Lack of Visibility Into Team Progress

Admins can’t track subordinate progress in the app and must rely on scattered Google Sheets or email updates.

HOW MIGHT WE

Improve the admin visibility of tasks performed by all collection & lab users to help them monitor and inform ES processes
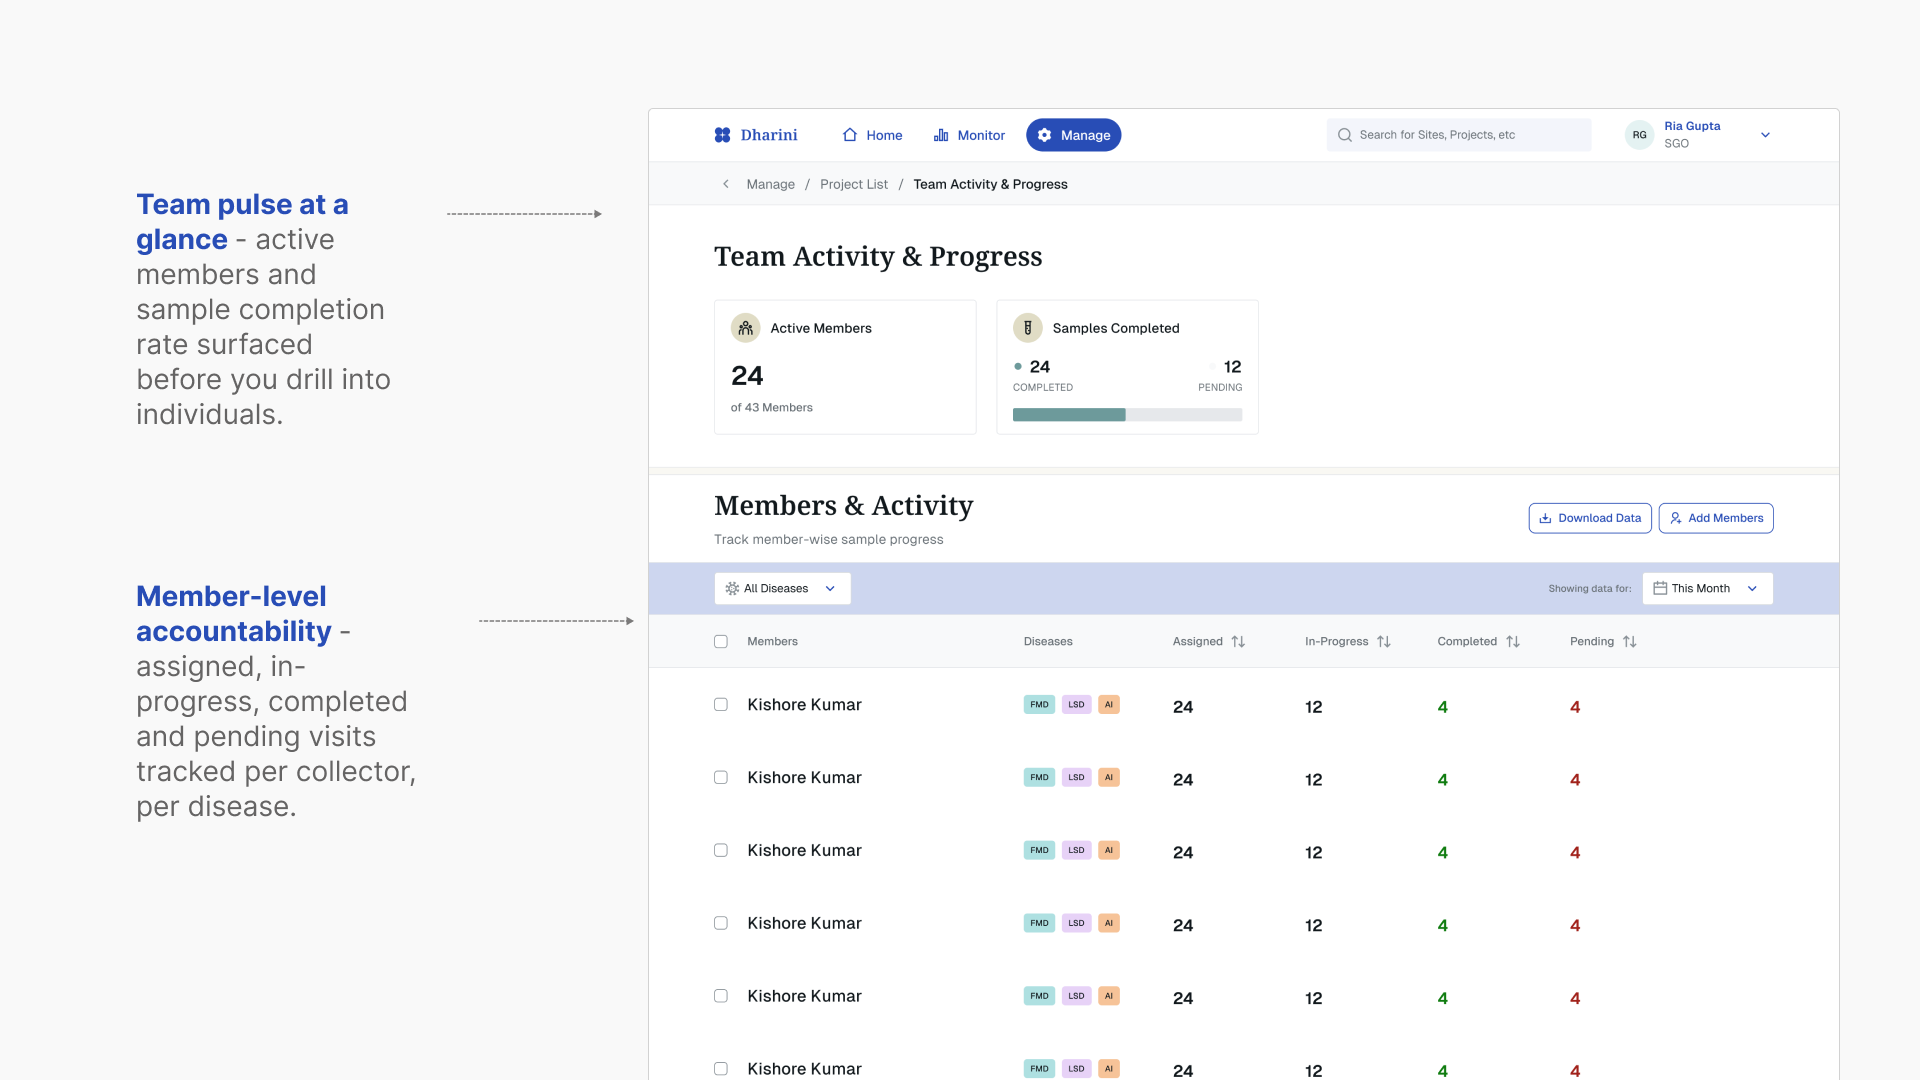
Admin team progress visibility

REFLECTION

Little wins from this project

✦

Ensured a frictionless design handoff, staying closely aligned with developers through full implementation.

✦

Demonstrated fast learning agility, quickly digesting deep research and shaping early solution directions.

✦

Felt the reward of designing with real societal impact, as the tools support government public health programs.